Comparative Study
. 2005 Dec 1;172(11):1399-411.
doi: 10.1164/rccm.200502-286OC. Epub 2005 Aug 11.

Gene expression changes during the development of acute lung injury: role of transforming growth factor beta

Affiliations
Comparative Study

Gene expression changes during the development of acute lung injury: role of transforming growth factor beta

Scott C Wesselkamper et al. Am J Respir Crit Care Med. .

Abstract

Rationale: Acute lung injury can occur from multiple causes, resulting in high mortality. The pathophysiology of nickel-induced acute lung injury in mice is remarkably complex, and the molecular mechanisms are uncertain.

Objectives: To integrate molecular pathways and investigate the role of transforming growth factor beta (TGF-beta) in acute lung injury in mice.

Methods: cDNA microarray analyses were used to identify lung gene expression changes after nickel exposure. MAPPFinder analysis of the microarray data was used to determine significantly altered molecular pathways. TGF-beta1 protein in bronchoalveolar lavage fluid, as well as the effect of inhibition of TGF-beta, was assessed in nickel-exposed mice. The effect of TGF-beta on surfactant-associated protein B (Sftpb) promoter activity was measured in mouse lung epithelial cells.

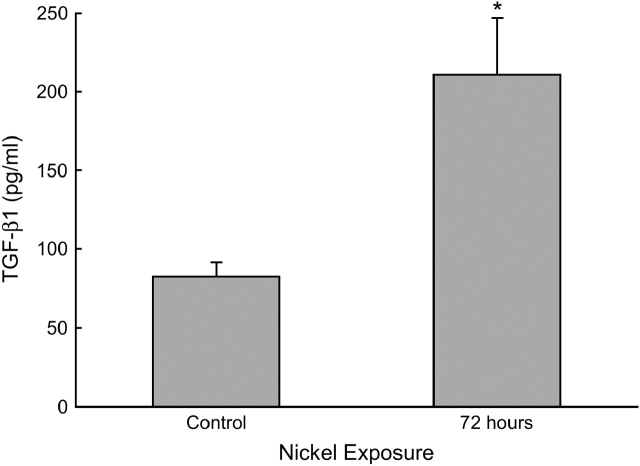
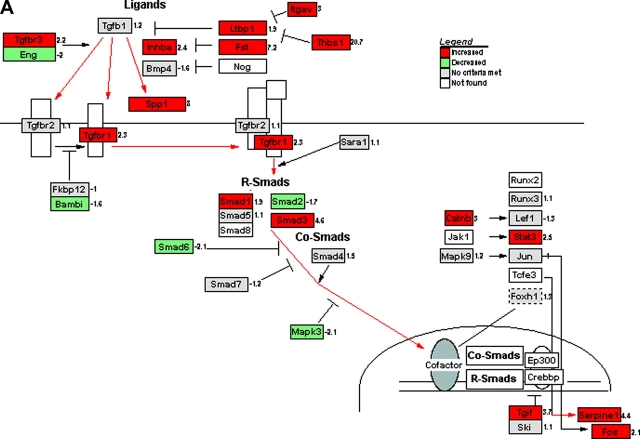
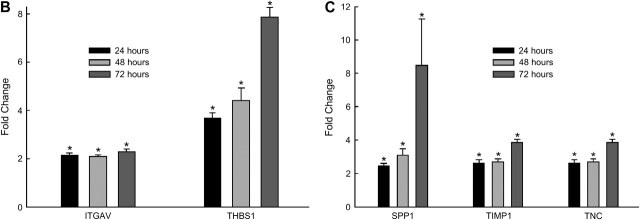
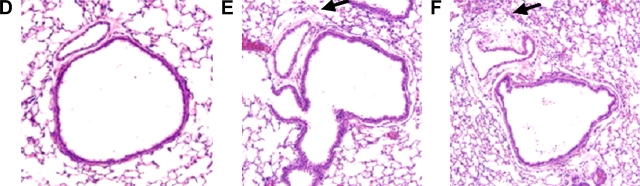
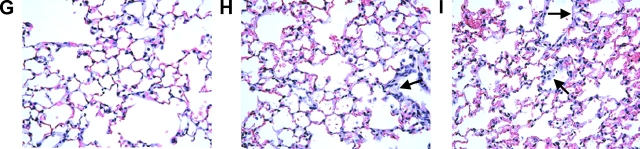
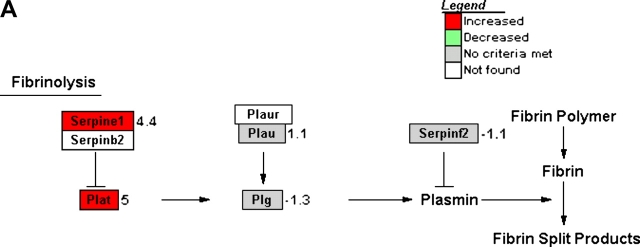
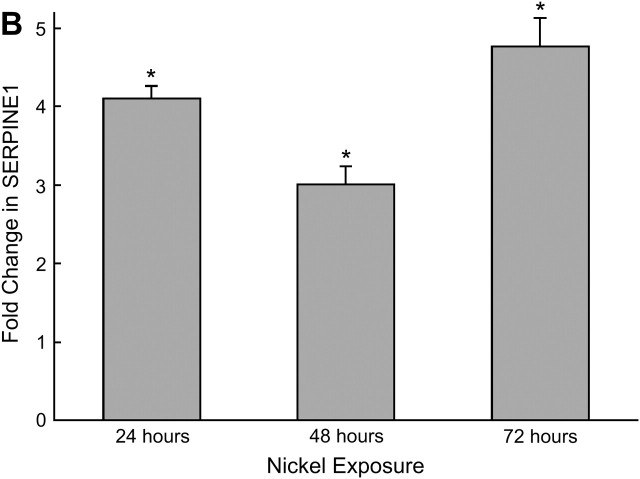
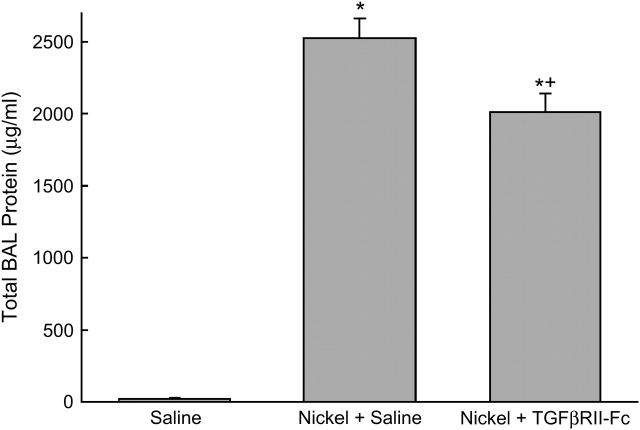
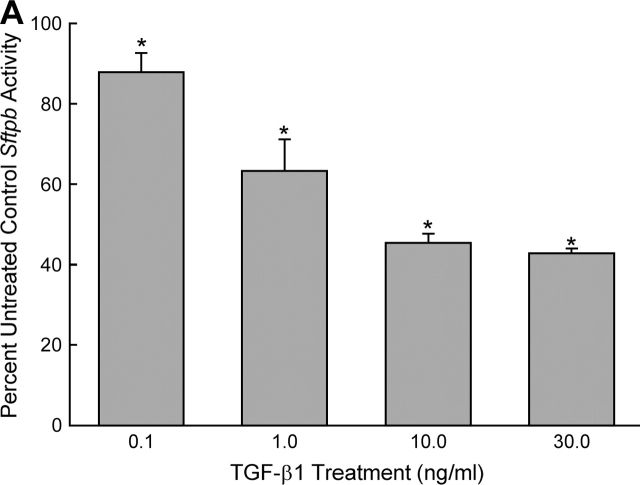
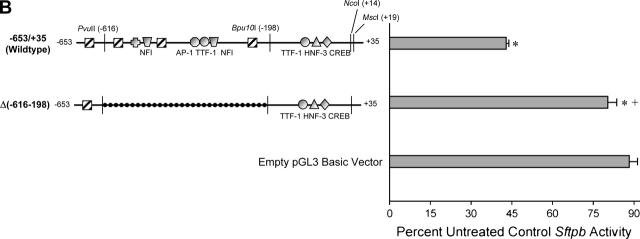
Measurements and main results: Genes that decreased the most after nickel exposure play important roles in lung fluid absorption or surfactant and phospholipid synthesis, and genes that increased the most were involved in TGF-beta signaling. MAPPFinder analysis further established TGF-beta signaling to be significantly altered. TGF-beta-inducible genes involved in the regulation of extracellular matrix function and fibrinolysis were significantly increased after nickel exposure, and TGF-beta1 protein was also increased in the lavage fluid. Pharmacologic inhibition of TGF-beta attenuated nickel-induced protein in bronchoalveolar lavage. In addition, treatment with TGF-beta1 dose-dependently repressed Sftpb promoter activity in vitro, and a novel TGF-beta-responsive region in the Sftpb promoter was identified.

Conclusions: These data suggest that TGF-beta acts as a central mediator of acute lung injury through the alteration of several different molecular pathways.


Figures

<b>Figure 1.</b>
Figure 1.
Increased transforming growth factor (TGF)-β protein in lungs of mice exposed to nickel for 72 h. TGF-β1 in bronchoalveolar lavage fluid (BALF) was measured by ELISA. Data are presented as means ± SEM (n = 5 mice/group). * Denotes significant difference from nonexposed control group, p < 0.05.
<b>Figure 2.</b>
Figure 2.
Expression changes in genes of the TGF-β signaling pathway in lungs of mice exposed to nickel as measured by oligonucleotide microarray and reverse transcriptase–polymerase chain reaction (RT-PCR). (A) Changes in gene expression are expressed using the GenMAPP format. Genes that were increased atleast 1.5-fold over control values and had a significance value of p ⩽ 0.05 are labeled in red. Those genes that were decreased atleast 1.5-fold from control values and had a significance value of p ⩽ 0.05 are labeled in green. Those genes that did not meet the aforementioned criteria are labeled in gray, and those genes that were not on the array are labeled in white. (B) RT-PCR analysis of mRNA for genes that are activators of TGF-β after 24, 48, or 72 h of exposure. Data are presented as fold changes over control values (n = 5 mice/group, means ± SEM) and are normalized to ribosomal protein S2 (Rps2) expression. * Denotes significant difference from nonexposed control group, p < 0.05. ITGAV = integrin αV; THBS1 = thrombospondin 1. (C) RT-PCR analysis of mRNA for genes that are activated by TGF-β after 24, 48, or 72 h of exposure. Data are presented as fold changes over control values (n = 5 mice/group, means ± SEM) and are normalized to Rps2 expression. * Denotes significant difference from nonexposed control group, p < 0.05. SPP1 = secreted phosphoprotein 1; TIMP1 = tissue inhibitor of metalloproteinase 1; TNC = tenascin C.
<b>Figure 3.</b>
Figure 3.
Gross pathology (AC) and light microscope histology (DI) of lungs of mice exposed to nickel for 48 and 72 h, and nonexposed control animals. (A) Nonexposed control lung, (B) 48-h exposed lung, (C) 72-h exposed lung, (D) non-exposed control (original magnification × 40), (E) 48-h exposed (original magnification × 40), (F) 72-h exposed (original magnification × 40), (G) nonexposed control (original magnification × 400), (H) 48-h exposed (original magnification × 400), (I) 72-h exposed (original magnification × 400). The gross pathologic progression of acute lung injury is apparent, with the lung surface appearing in red from hemorrhage and coagulation as exposure progressed as compared with nonexposed control lungs (AC). Histologic analysis of lung sections from nickel-exposed mice compared with control animals showed a progressive increase in perivascular swelling (arrows, E and F) and alveolar wall thickening (arrows, H and I).
<b>Figure 4.</b>
Figure 4.
Expression changes in genes of the fibrinolysis signaling pathway in lungs of mice exposed to nickel for 72 h as measured by oligonucleotide microarray and RT-PCR. (A) Changes in gene expression are expressed using the GenMAPP format. Genes that were increased at least 1.5-fold over control values and had a significance value of p ⩽ 0.05 are labeled in red. Those genes that were decreased at least 1.5-fold from control values and had a significance value of p ⩽ 0.05 are labeled in green. Those genes that did not meet the aforementioned criteria are labeled in gray, and those genes that were not on the array are labeled in white. (B) RT-PCR analysis of serine (or cysteine) proteinase inhibitor, clade E, member 1 (Serpine1) mRNA after 24, 48, or 72 h of exposure. Data are presented as fold changes over control values (n = 5 mice/group, means ± SEM) and are normalized to Rps2 expression. * Denotes significant difference from nonexposed control group, p < 0.05.
<b>Figure 5.</b>
Figure 5.
Soluble chimeric TGF-β type II receptor (TGFβRII-Fc) attenuates nickel-induced BAL protein in 129S1/SvImJ mice. Mice were intravenously administered TGFβRII-Fc (50 μg in 50 μl sterile saline) or saline alone immediately before and 6 and 30 h after a 24-h exposure to nickel. Nonexposed control mice were also concurrently injected with saline. All mice were lavaged 72 h after the initiation of nickel-exposure. Data are presented as means ± SEM. * Denotes significant difference from nonexposed saline-treated control group, p < 0.05; +denotes significant difference from nickel-exposed saline-treated group, p < 0.05.
<b>Figure 6.</b>
Figure 6.
Repression of Sftpb promoter activity by TGF-β1 in vitro. (A) Transient transfections of the −653/+35 (wild-type) mouse Sftpb luciferase promoter construct were done in MLE-15 cells (750 ng of construct/well and 250 ng of cytomegalovirus promoter–β-galactosidase/well as an internal control) and treated with 0.1, 1.0, 10, and 30 ng/ml TGF-β1 for 24 h. (B) Transient transfections of the −653/+35 (wild-type) and Δ(−616/−198) mouse Sftpb luciferase promoter constructs were done in MLE-15 cells (750 ng of construct/well and 250 ng of pCMV–β-galactosidase/well as an internal control) and treated with 30 ng/ml TGF-β1 for 24 h. For both panels, relative luciferase activities normalized to cotransfected β-galactosidase are expressed as percentage of untreated control values. Values are means ± SEM (n = 5–11/group). * Denotes significant difference from untreated control, p < 0.05; + denotes significant difference from −653/+35 (wild-type) Sftpb promoter construct, p < 0.05. Striped boxes denote location of “CAGA” elements. Other promoter elements are as labeled in the figure. CREB = cydic adenosine monophosphate (CAMP)–responsive element-binding protein; HNF-3 = hepatocyte nuclear factor 3; TTF-1 = thyroid transcription factor 1.
<b>Figure 7.</b>
Figure 7.
Schematic diagram of the role of TGF-β in acute lung injury. After exposure to nickel, TGF-β is increased in the lungs of mice. TGF-β and TGF-β–inducible genes are able to modify lung permeability, epithelial ion transport, fibrinolysis, the extracellular matrix, and surfactant homeostasis. The integration of the changes in these molecular pathways by TGF-β implicates it as a central mediator of acute lung injury.

Similar articles

Cited by

References

    1. Ware LB, Matthay MA. The acute respiratory distress syndrome. N Engl J Med 2000;342:1334–1349. - PubMed
    1. Lewis JF, Jobe AH. Surfactant and the adult respiratory distress syndrome. Am Rev Respir Dis 1993;147:218–233. - PubMed
    1. Grande JP. Role of transforming growth factor-beta in tissue injury and repair. Proc Soc Exp Biol Med 1997;214:27–40. - PubMed
    1. Singer AJ, Clark RA. Cutaneous wound healing. N Engl J Med 1999;341:738–746. - PubMed
    1. Broekelmann TJ, Limper AH, Colby TV, McDonald JA. Transforming growth factor beta 1 is present at sites of extracellular matrix gene expression in human pulmonary fibrosis. Proc Natl Acad Sci USA 1991;88:6642–6646. - PMC - PubMed

Publication types

MeSH terms