

Imaging and quantifying carbohydrate transport to the developing ovaries of maize
- PMID: 16100223
- PMCID: PMC4247060
- DOI: 10.1093/aob/mci246
Imaging and quantifying carbohydrate transport to the developing ovaries of maize
Abstract
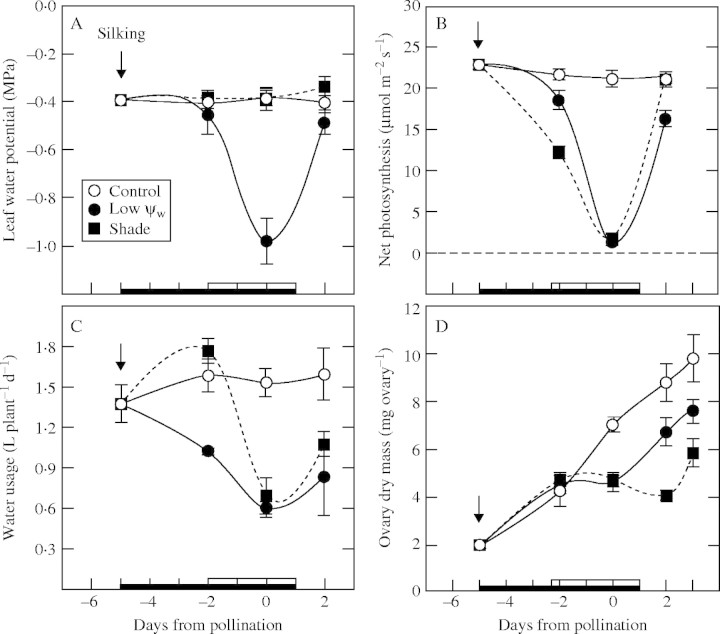
Background and aims: Shade or inadequate water can inhibit photosynthesis and limit the development of maize (Zea mays) ovaries around the time of pollination, potentially reducing the number of kernels at harvest. This study investigated whether the decreased photosynthesis diminished only the sugar supply or also altered the transport path to the ovaries.
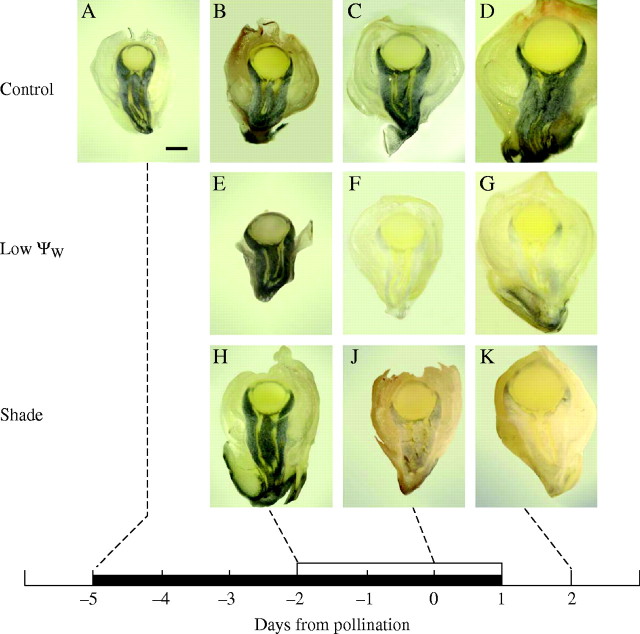
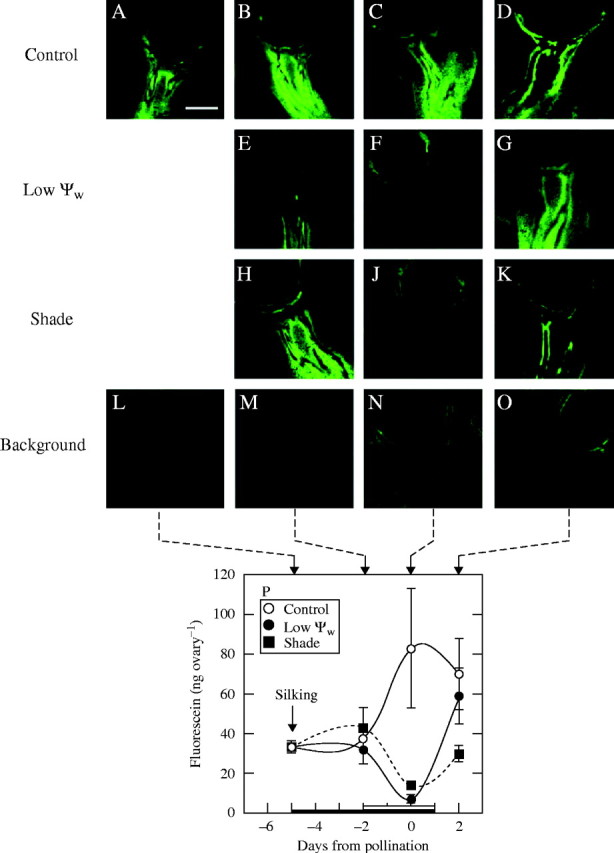
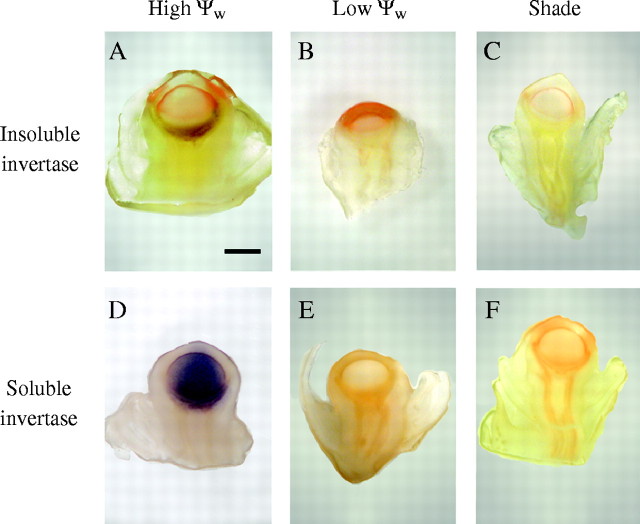
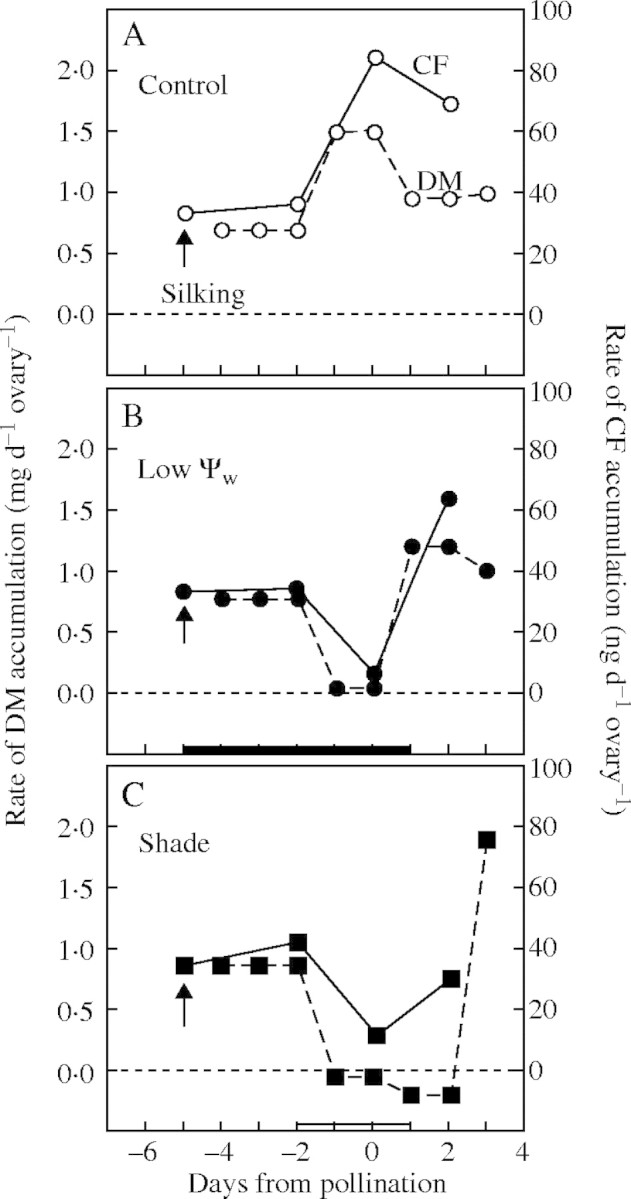
Methods: Photosynthesis and water potentials (Psiw) were measured in the leaves while dry matter delivery was monitored in the ovaries. Ovary glucose, starch and acid invertase activities were measured in situ. Stems were fed xylem-mobile safranin or phloem-mobile carboxyfluorescein (CF), and the dye transport to the ovaries was determined.
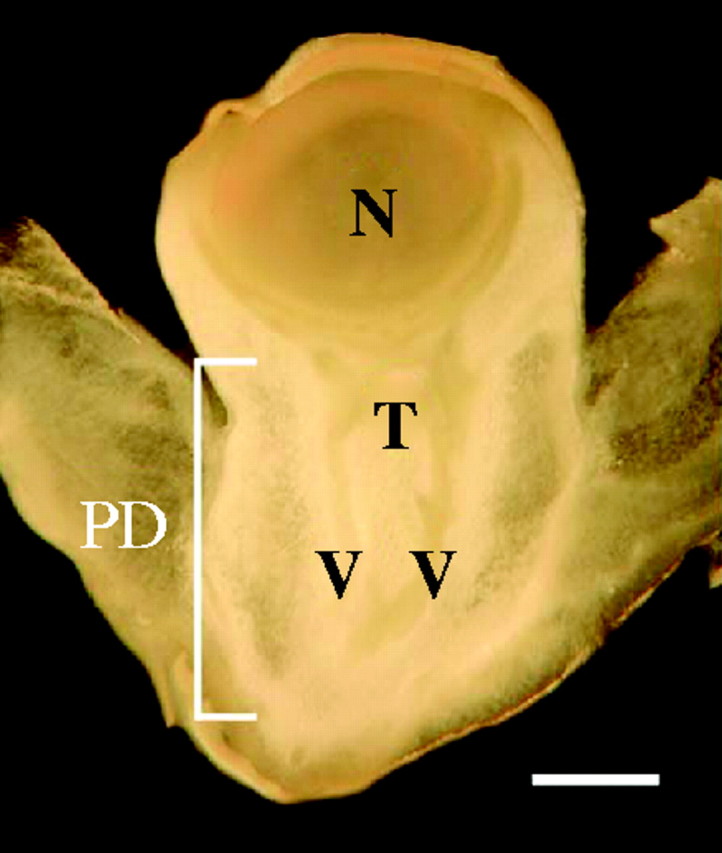
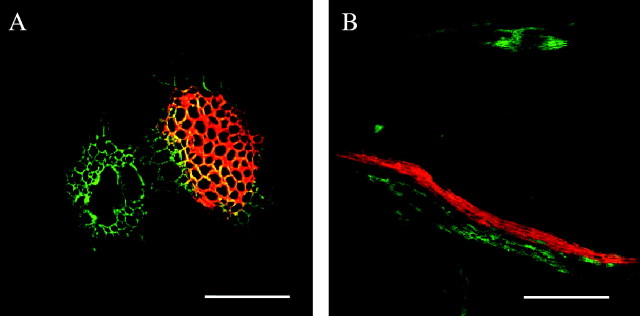
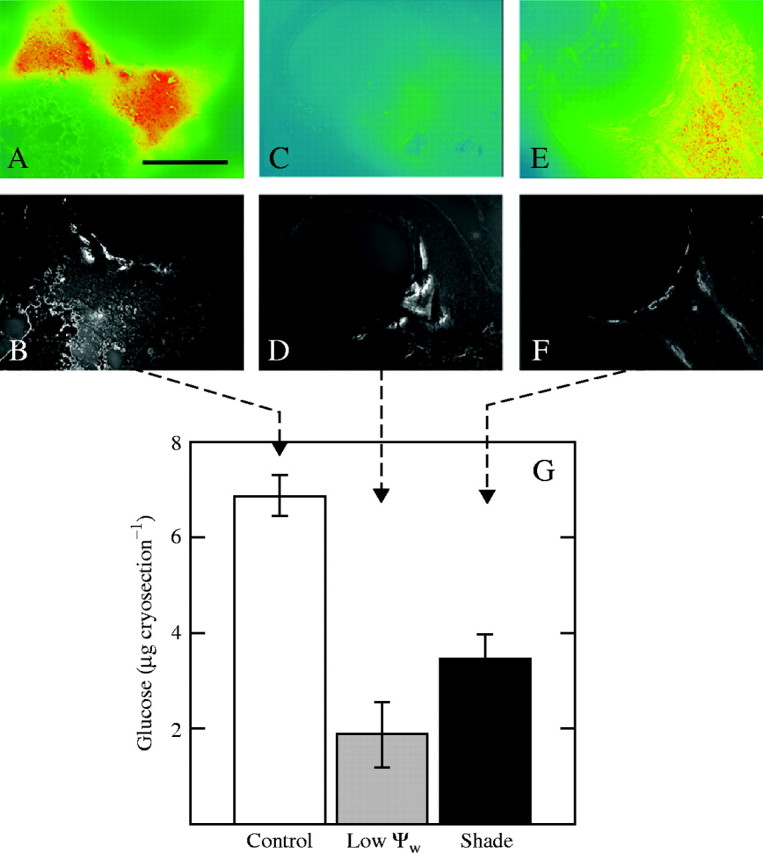
Key results: Under normal conditions, the ovaries gained in dry mass, and starch accumulated in the pedicel and ovary wall. Glucose accumulated in the pedicel, apparently in the apoplast where insoluble (cell-wall-bound) acid invertase acted on the arriving sucrose. A glucose gradient developed from pedicel to nucellus. Safranin moved in the xylem and did not reach the ovary, but CF moved in the phloem and arrived at the ovary. CF also spread into the pedicel but unlike glucose it did not enter the nucellus. Low Psiw or shade decreased leaf photosynthesis, ovary dry mass accumulation, invertase activities, pedicel glucose, starch accumulation and CF delivery. Removal of these treatments reversed the effects.
Conclusions: The success of CF in tracing the general path and rate of carbohydrate transport gave visual evidence that phloem transport to the ovary decreased at low Psiw or in the shade but otherwise remained functional. The decreases indicated that losses in carbohydrate delivery are central features of failed ovary development under these conditions. The selectivity of transport into the nucellus resembled the situation later when embryo and endosperm are present and selective uptake occurs from the apoplast.
Figures
Similar articles
-
Glucose localization in maize ovaries when kernel number decreases at low water potential and sucrose is fed to the stems.Ann Bot. 2004 Jul;94(1):75-86. doi: 10.1093/aob/mch123. Epub 2004 May 24. Ann Bot. 2004. PMID: 15159218 Free PMC article.
-
Sugar-responsive gene expression, invertase activity, and senescence in aborting maize ovaries at low water potentials.Ann Bot. 2004 Nov;94(5):675-89. doi: 10.1093/aob/mch193. Epub 2004 Sep 8. Ann Bot. 2004. PMID: 15355866 Free PMC article.
-
Soluble invertase expression is an early target of drought stress during the critical, abortion-sensitive phase of young ovary development in maize.Plant Physiol. 2002 Oct;130(2):591-604. doi: 10.1104/pp.005637. Plant Physiol. 2002. PMID: 12376627 Free PMC article.
-
Grain yields with limited water.J Exp Bot. 2004 Nov;55(407):2385-94. doi: 10.1093/jxb/erh219. Epub 2004 Jul 30. J Exp Bot. 2004. PMID: 15286147 Review.
-
Understanding and manipulating sucrose phloem loading, unloading, metabolism, and signalling to enhance crop yield and food security.J Exp Bot. 2014 Apr;65(7):1713-35. doi: 10.1093/jxb/ert416. Epub 2013 Dec 17. J Exp Bot. 2014. PMID: 24347463 Review.
Cited by
-
Post-silking carbon partitioning under nitrogen deficiency revealed sink limitation of grain yield in maize.J Exp Bot. 2018 Mar 24;69(7):1707-1719. doi: 10.1093/jxb/erx496. J Exp Bot. 2018. PMID: 29361032 Free PMC article.
-
Is Change in Ovary Carbon Status a Cause or a Consequence of Maize Ovary Abortion in Water Deficit during Flowering?Plant Physiol. 2016 Jun;171(2):997-1008. doi: 10.1104/pp.15.01130. Epub 2016 Apr 19. Plant Physiol. 2016. PMID: 27208256 Free PMC article.
-
Transcriptome analysis of the phytobacterium Xylella fastidiosa growing under xylem-based chemical conditions.J Biomed Biotechnol. 2010;2010:781365. doi: 10.1155/2010/781365. Epub 2010 Jun 13. J Biomed Biotechnol. 2010. PMID: 20625415 Free PMC article.
-
Staying Alive or Going to Die During Terminal Senescence-An Enigma Surrounding Yield Stability.Front Plant Sci. 2015 Nov 30;6:1070. doi: 10.3389/fpls.2015.01070. eCollection 2015. Front Plant Sci. 2015. PMID: 26648957 Free PMC article. Review.
-
Sucrose feeding reverses shade-induced kernel losses in maize.Ann Bot. 2010 Sep;106(3):395-403. doi: 10.1093/aob/mcq132. Epub 2010 Jul 8. Ann Bot. 2010. PMID: 20616114 Free PMC article.
References
-
- Boyer JS. 1995.Measuring the water status of plants and soils. San Diego: Academic Press.
-
- Boyle MG, Boyer JS, Morgan PW. 1991. Stem infusion of maize plants. Crop Science 31: 1241–1245.
-
- Boyle MG, Boyer JS, Morgan PW. 1991. Stem infusion of liquid culture medium prevents reproductive failure of maize at low water potential. Crop Science 3: 1246–1252.
-
- Bradford KJ. 1994. Water stress and the water relations of seed development: a critical review. Crop Science 34: 1–11.
