. 2005 Nov;89(5):2927-38.
doi: 10.1529/biophysj.105.063016. Epub 2005 Aug 12.

A model for diffusion in white matter in the brain

Affiliations

A model for diffusion in white matter in the brain

Pabitra N Sen et al. Biophys J. 2005 Nov.

Abstract

Diffusion of molecules in brain and other tissues is important in a wide range of biological processes and measurements ranging from the delivery of drugs to diffusion-weighted magnetic resonance imaging. Diffusion tensor imaging is a powerful noninvasive method to characterize neuronal tissue in the human brain in vivo. As a first step toward understanding the relationship between the measured macroscopic apparent diffusion tensor and underlying microscopic compartmental geometry and physical properties, we treat a white matter fascicle as an array of identical thick-walled cylindrical tubes arranged periodically in a regular lattice and immersed in an outer medium. Both square and hexagonal arrays are considered. The diffusing molecules may have different diffusion coefficients and concentrations (or densities) in different domains, namely within the tubes' inner core, membrane, myelin sheath, and within the outer medium. Analytical results are used to explore the effects of a large range of microstructural and compositional parameters on the apparent diffusion tensor and the degree of diffusion anisotropy, allowing the characterization of diffusion in normal physiological conditions as well as changes occurring in development, disease, and aging. Implications for diffusion tensor imaging and for the possible in situ estimation of microstructural parameters from diffusion-weighted MR data are discussed in the context of this modeling framework.


Figures

FIGURE 1
FIGURE 1
A schematic diagram of a myelinated axon. The axonal membrane contains short active regions, nodes of Ranvier, which are joined by long passive segments insulated by myelin. The outer radius of the axon is rs; its inner radius rc. Diffusion across myelin is hindered by layers of lipid bilayers (in addition to the myelin sheath). A separate membrane skin can be added to our calculation, but is not considered here. In the model, we treat the myelin and membrane as a composite and the permeability is determined by the combined effect of the membrane and the myelin sheath.
FIGURE 2
FIGURE 2
The unit cell for a square array of coated cylinders representing white matter with a myelin sheath. The equilibrium concentrations such as Cs0, etc., and corresponding diffusion coefficients Ds, etc., of each region as well as the inner and outer radii, rc, and rs, respectively, can be different. The cylinders can be made to touch each other by taking formula image
FIGURE 3
FIGURE 3
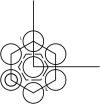
Nearest neighbors around the central cylinder of a portion of a hexagonal array of coated cylinders. To simplify, only one cylinder is depicted as coated, and only the outer radius is shown for the others. The Wigner-Seitz cell is shown by dashed lines (inner hexagon). Centers of cylinders are separated by a distance L, hence formula image where rs is the outer radius.
FIGURE 4
FIGURE 4
Mean diffusion coefficient 〈ADC〉 = (2Dt,eff + Dl,eff)/3 as a function of the myelin sheath radius rs develops from its minimum value of rc to that allowed by hexagonal close pack. Here, rc = 6 μm, Db = 2 × 10⁻⁹m2/s, Cb0 = 0.95, Dc = 7.5 × 10⁻¹⁰m2/s, Cc0 = 0.88, Ds = 3 × 10⁻¹¹m2/s, Cs0 = 0.5, L = 18.2 μm.
FIGURE 5
FIGURE 5
Degree of diffusion anisotropy Dl,eff/Dt,eff as a function of the myelin sheath radius rs develops from its minimum value of rc to that allowed by hexagonal close pack. Here rc = 6 μm, Db = 2 × 10⁻⁹m2/s, Cb0 = 0.95, Dc = 7.5 × 10⁻¹⁰m2/s, Cc0 = 0.88, Ds = 3 × 10⁻¹¹m2/s, Cs0 = 0.5, L = 18.2 μm.
FIGURE 6
FIGURE 6
Angular profile of ADCt,eff = Dt,eff cos2 θ + Dl,eff sin2 θ in units of Db as a function of the polar angle, θ in a hexagonal close pack. Here the parameters rc = 7.2 μm, rs = 9.77 μm, Db = 2 × 10⁻⁹m2/s, Cb0 = 0.95, Dc = 7.5 × 10⁻¹⁰m2/s, Cc0 = 0.88, Ds = 3 × 10⁻¹¹m2/s, Cs0 = 0.5, L = 17.71 μm are chosen to represent cytotoxic edema.

References

    1. Moseley, M., Y. Cohen, J. Mintorovitch, L. Chileuitt, H. Shimizu, J. Kucharczyk, M. Wendland, and P. Weinstein. 1990. Early detection of regional cerebral ischemia in cats: comparison of diffusion and T2 weighted MRI and spectroscopy. Magn. Reson. Med. 14:330–346. - PubMed
    1. Warach, S., J. Gaa, B. Siewert, P. Wielopolski, and R. R. Edelman. 1995. Acute human stroke studied by whole brain echo planar diffusion-weighted magnetic resonance imaging. Ann. Neurol. 37:231–241. - PubMed
    1. http://www.ninds.nih.gov/disorders/stroke/detail_stroke_pr.htm. [Online].
    1. Basser, P. J., S. Pajevic, C. Pierpaoli, J. Duda, and A. Aldroubi. 2000. In vivo fiber tractography using DT-MRI data. Magn. Reson. Med. 44:625–632. - PubMed
    1. Basser, P. J., J. Mattiello, and D. Le Bihan. 1994. MR diffusion tensor spectroscopy and imaging. Biophys. J. 66:259–267. - PMC - PubMed