

Periodic patterns of actin turnover in lamellipodia and lamellae of migrating epithelial cells analyzed by quantitative Fluorescent Speckle Microscopy
- PMID: 16100274
- PMCID: PMC1366841
- DOI: 10.1529/biophysj.104.058701
Periodic patterns of actin turnover in lamellipodia and lamellae of migrating epithelial cells analyzed by quantitative Fluorescent Speckle Microscopy
Abstract
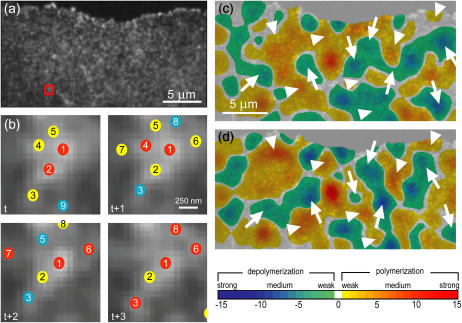
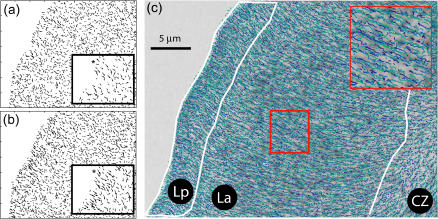
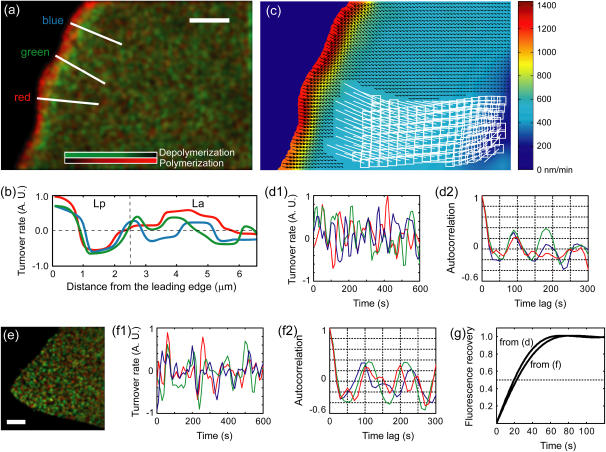
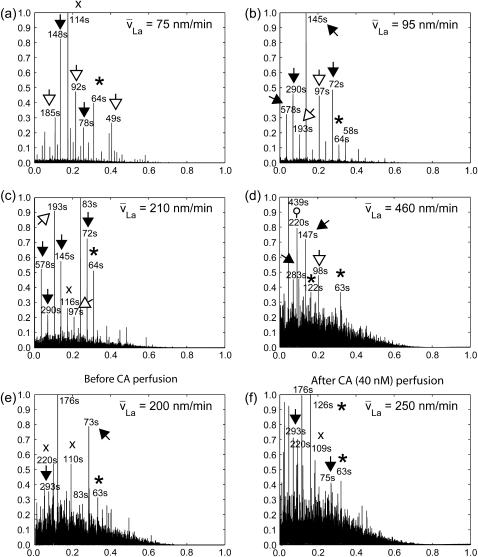
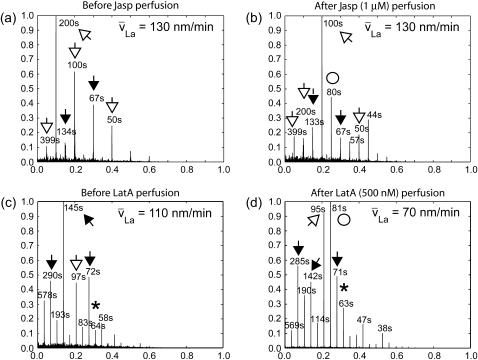
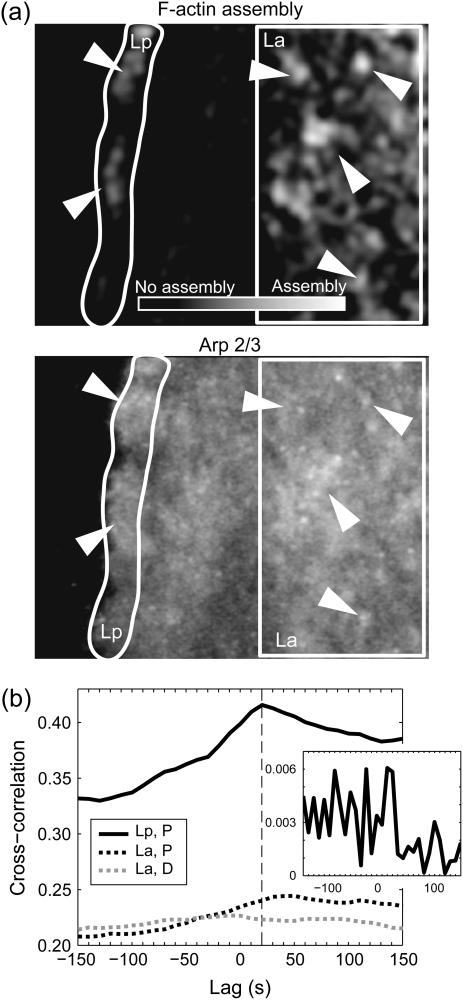
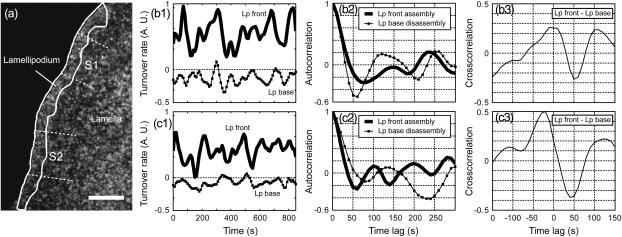
We measured actin turnover in lamellipodia and lamellae of migrating cells, using quantitative Fluorescent Speckle Microscopy. Lamellae disassembled at low rates from the front to the back. However, the dominant feature in their turnover was a spatially random pattern of periodic polymerization and depolymerization moving with the retrograde flow. Power spectra contained frequencies between 0.5 and 1 cycle/min. The spectra remained unchanged when applying Latrunculin A and Jasplakinolide in low doses, except that additional frequencies occurred beyond 1 cycle/min. Whereas Latrunculin did not change the rate of mean disassembly, Jasplakinolide halted it completely, indicating that the steady state and the dynamics of actin turnover are differentially affected by pharmacological agents. Lamellipodia assembled in recurring bursts at the leading edge and disassembled approximately 2.5 microm behind. Events of polymerization correlated spatially and temporally with transient formation of Arp2/3 clusters. In lamellae, Arp2/3 accumulation and polymerization correlated only spatially, suggesting an Arp2/3-independent mechanism for filament nucleation. To acquire these data we had to enhance the resolution of quantitative Fluorescent Speckle Microscopy to the submicron level. Several algorithmic advances in speckle image processing are described enabling the analysis of kinetic and kinematic activities of polymer networks at the level of single speckles.
Figures
Similar articles
-
Simultaneous mapping of filamentous actin flow and turnover in migrating cells by quantitative fluorescent speckle microscopy.Proc Natl Acad Sci U S A. 2004 Jun 29;101(26):9660-5. doi: 10.1073/pnas.0300552101. Epub 2004 Jun 21. Proc Natl Acad Sci U S A. 2004. PMID: 15210979 Free PMC article.
-
Actin turnover-dependent fast dissociation of capping protein in the dendritic nucleation actin network: evidence of frequent filament severing.J Cell Biol. 2006 Dec 18;175(6):947-55. doi: 10.1083/jcb.200604176. J Cell Biol. 2006. PMID: 17178911 Free PMC article.
-
Single-molecule speckle analysis of actin filament turnover in lamellipodia.Science. 2002 Feb 8;295(5557):1083-6. doi: 10.1126/science.1067470. Science. 2002. PMID: 11834838
-
Inside view of cell locomotion through single-molecule: fast F-/G-actin cycle and G-actin regulation of polymer restoration.Proc Jpn Acad Ser B Phys Biol Sci. 2010;86(1):62-83. doi: 10.2183/pjab.86.62. Proc Jpn Acad Ser B Phys Biol Sci. 2010. PMID: 20075609 Free PMC article. Review.
-
Role of actin polymerization in cell locomotion: molecules and models.Am J Respir Cell Mol Biol. 1993 Jun;8(6):582-91. doi: 10.1165/ajrcmb/8.6.582. Am J Respir Cell Mol Biol. 1993. PMID: 8323743 Free PMC article. Review.
Cited by
-
Actin dynamics: from nanoscale to microscale.Annu Rev Biophys. 2010;39:91-110. doi: 10.1146/annurev.biophys.093008.131207. Annu Rev Biophys. 2010. PMID: 20462375 Free PMC article. Review.
-
Use of virtual cell in studies of cellular dynamics.Int Rev Cell Mol Biol. 2010;283:1-56. doi: 10.1016/S1937-6448(10)83001-1. Int Rev Cell Mol Biol. 2010. PMID: 20801417 Free PMC article. Review.
-
Multi-scale models of cell and tissue dynamics.Philos Trans A Math Phys Eng Sci. 2009 Sep 13;367(1902):3525-53. doi: 10.1098/rsta.2009.0095. Philos Trans A Math Phys Eng Sci. 2009. PMID: 19657010 Free PMC article.
-
Cofilin activity downstream of Pak1 regulates cell protrusion efficiency by organizing lamellipodium and lamella actin networks.Dev Cell. 2007 Nov;13(5):646-662. doi: 10.1016/j.devcel.2007.08.011. Dev Cell. 2007. PMID: 17981134 Free PMC article.
-
Protrusion and actin assembly are coupled to the organization of lamellar contractile structures.Exp Cell Res. 2010 Aug 1;316(13):2027-41. doi: 10.1016/j.yexcr.2010.04.011. Epub 2010 Apr 18. Exp Cell Res. 2010. PMID: 20406634 Free PMC article.
References
Publication types
MeSH terms
Substances
Grants and funding
LinkOut - more resources
Full Text Sources
Molecular Biology Databases
