

Radial compression of microtubules and the mechanism of action of taxol and associated proteins
- PMID: 16100275
- PMCID: PMC1366837
- DOI: 10.1529/biophysj.104.057679
Radial compression of microtubules and the mechanism of action of taxol and associated proteins
Abstract
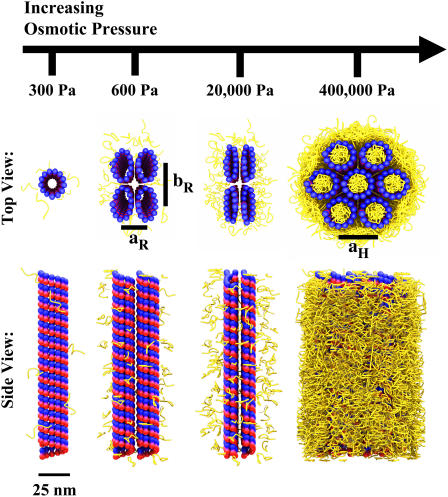
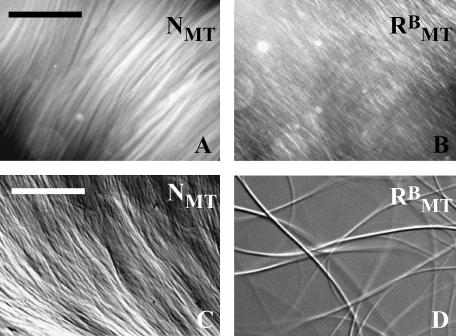
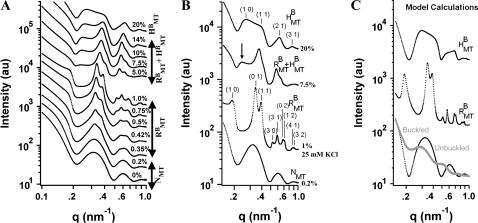
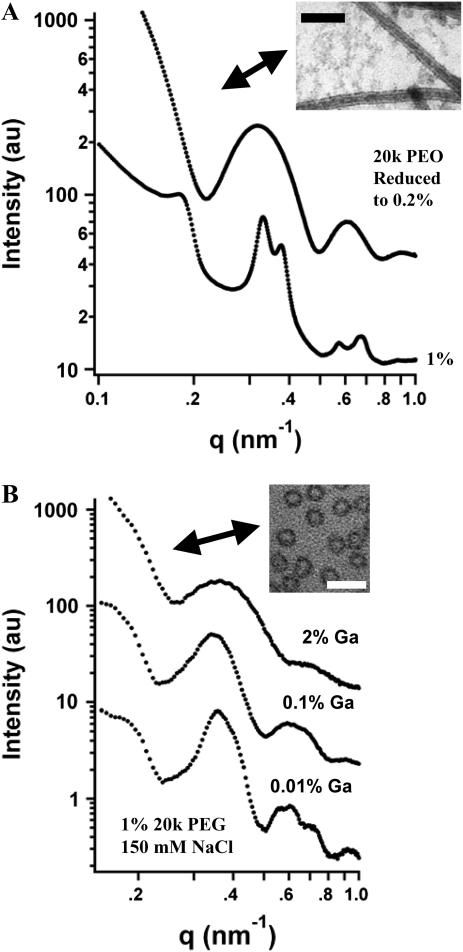
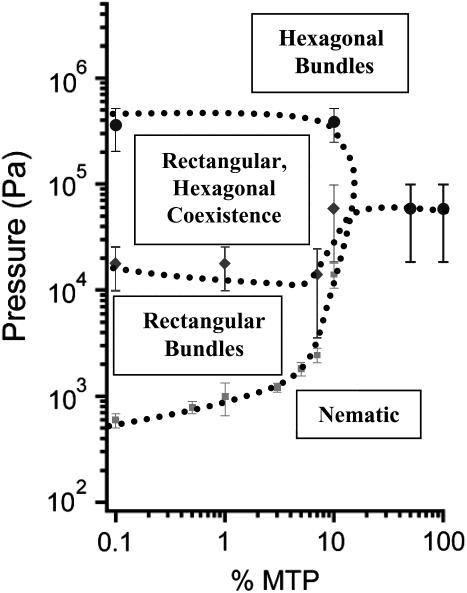
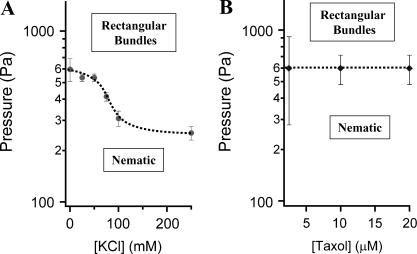
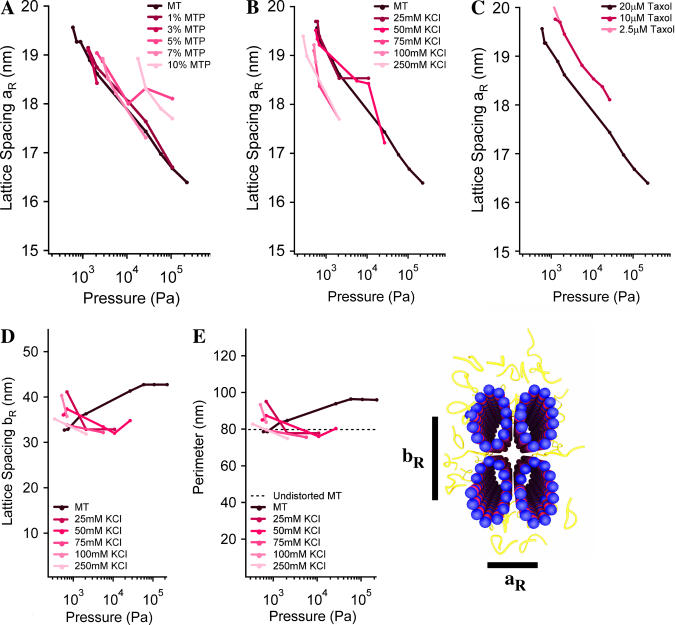
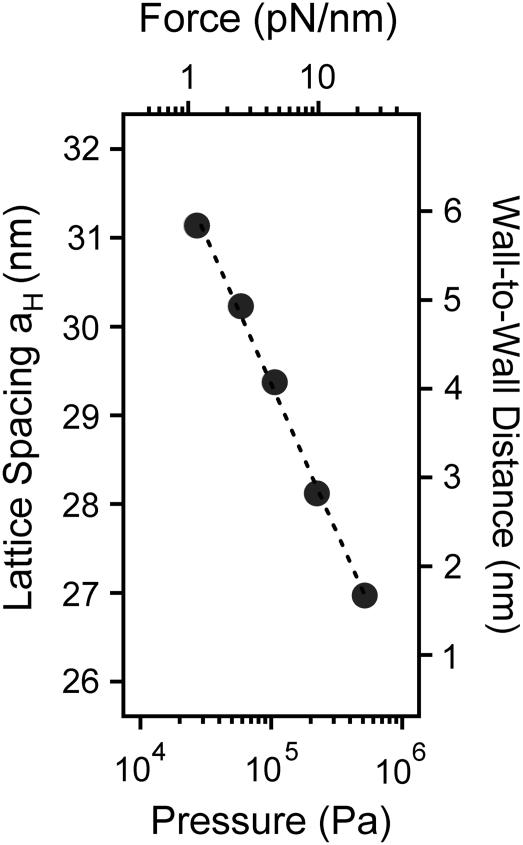
Microtubules (MTs) are hollow cylindrical polymers composed of alphabeta-tubulin heterodimers that align head-to-tail in the MT wall, forming linear protofilaments that interact laterally. We introduce a probe of the interprotofilament interactions within MTs and show that this technique gives insight into the mechanisms by which MT-associated proteins (MAPs) and taxol stabilize MTs. In addition, we present further measurements of the mechanical properties of MT walls, MT-MT interactions, and the entry of polymers into the MT lumen. These results are obtained from a synchrotron small angle x-ray diffraction (SAXRD) study of MTs under osmotic stress. Above a critical osmotic pressure, P(cr), we observe rectangular bundles of MTs whose cross sections have buckled to a noncircular shape; further increases in pressure continue to distort MTs elastically. The P(cr) of approximately 600 Pa provides, for the first time, a measure of the bending modulus of the interprotofilament bond within an MT. The presence of neuronal MAPs greatly increases P(cr), whereas surprisingly, the cancer chemotherapeutic drug taxol, which suppresses MT dynamics and inhibits MT depolymerization, does not affect the interprotofilament interactions. This SAXRD-osmotic stress technique, which has enabled measurements of the mechanical properties of MTs, should find broad application for studying interactions between MTs and of MTs with MAPs and MT-associated drugs.
Figures
Similar articles
-
The effect of multivalent cations and Tau on paclitaxel-stabilized microtubule assembly, disassembly, and structure.Adv Colloid Interface Sci. 2016 Jun;232:9-16. doi: 10.1016/j.cis.2015.11.002. Epub 2015 Nov 11. Adv Colloid Interface Sci. 2016. PMID: 26684364 Free PMC article. Review.
-
Synchrotron X-ray diffraction study of microtubules buckling and bundling under osmotic stress: a probe of interprotofilament interactions.Phys Rev Lett. 2004 Nov 5;93(19):198104. doi: 10.1103/PhysRevLett.93.198104. Epub 2004 Nov 4. Phys Rev Lett. 2004. PMID: 15600887
-
Human microtubule-associated-protein tau regulates the number of protofilaments in microtubules: a synchrotron x-ray scattering study.Biophys J. 2009 Jul 22;97(2):519-27. doi: 10.1016/j.bpj.2009.04.047. Biophys J. 2009. PMID: 19619466 Free PMC article.
-
Structure of Dynamic, Taxol-Stabilized, and GMPPCP-Stabilized Microtubule.J Phys Chem B. 2017 Sep 14;121(36):8427-8436. doi: 10.1021/acs.jpcb.7b01057. Epub 2017 Sep 1. J Phys Chem B. 2017. PMID: 28820593
-
Minireview - Microtubules and Tubulin Oligomers: Shape Transitions and Assembly by Intrinsically Disordered Protein Tau and Cationic Biomolecules.Langmuir. 2019 Dec 3;35(48):15970-15978. doi: 10.1021/acs.langmuir.9b02208. Epub 2019 Oct 2. Langmuir. 2019. PMID: 31539262 Free PMC article. Review.
Cited by
-
Tuning the Properties of Active Microtubule Networks by Depletion Forces.Langmuir. 2021 Jul 6;37(26):7919-7927. doi: 10.1021/acs.langmuir.1c00426. Epub 2021 Jun 16. Langmuir. 2021. PMID: 34132558 Free PMC article.
-
Structure and dynamics of motor-driven microtubule bundles.Soft Matter. 2024 Jul 24;20(29):5715-5723. doi: 10.1039/d3sm01336g. Soft Matter. 2024. PMID: 38872426 Free PMC article.
-
The effect of multivalent cations and Tau on paclitaxel-stabilized microtubule assembly, disassembly, and structure.Adv Colloid Interface Sci. 2016 Jun;232:9-16. doi: 10.1016/j.cis.2015.11.002. Epub 2015 Nov 11. Adv Colloid Interface Sci. 2016. PMID: 26684364 Free PMC article. Review.
-
Acute Taxol nephrotoxicity: Histological and ultrastructural studies of mice kidney parenchyma.Saudi J Biol Sci. 2010 Apr;17(2):105-14. doi: 10.1016/j.sjbs.2010.02.003. Epub 2010 Feb 24. Saudi J Biol Sci. 2010. PMID: 23961065 Free PMC article.
-
Microtubules soften due to cross-sectional flattening.Elife. 2018 Jun 1;7:e34695. doi: 10.7554/eLife.34695. Elife. 2018. PMID: 29856317 Free PMC article.
References
-
- Lowe, J., H. Li, K. H. Downing, and E. Nogales. 2001. Refined structure of alpha beta-tubulin at 3.5 Å resolution. J. Mol. Biol. 313:1045–1057. - PubMed
-
- Li, H., D. J. DeRosier, W. V. Nicholson, E. Nogales, and K. H. Downing. 2002. Microtubule structure at 8 Å resolution. Structure. 10:1317–1328. - PubMed
-
- Desai, A., and T. J. Mitchison. 1997. Microtubule polymerization dynamics. Annu. Rev. Cell Dev. Biol. 13:83–117. - PubMed
Publication types
MeSH terms
Substances
Grants and funding
LinkOut - more resources
Full Text Sources
