Molecular dynamics study of bipolar tetraether lipid membranes
- PMID: 16100279
- PMCID: PMC1366815
- DOI: 10.1529/biophysj.105.060962
Molecular dynamics study of bipolar tetraether lipid membranes
Abstract
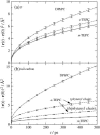
Membranes composed of bipolar tetraether lipids have been studied by a series of 25-ns molecular dynamics simulations to understand the microscopic structure and dynamics as well as membrane area elasticity. By comparing macrocyclic and acyclic tetraether and diether archaeal lipids, the effect of tail linkage of the two phytanyl-chained lipids on the membrane properties is elucidated. Tetraether lipids show smaller molecular area and lateral mobility. For the latter, calculated diffusion coefficients are indeed one order-of-magnitude smaller than that of the diether lipid. These two tetraether membranes are alike in many physical properties except for membrane area elasticity. The macrocyclic tetraether membrane shows a higher elastic area expansion modulus than its acyclic counterpart by a factor of three. Free energy profiles of a water molecule crossing the membranes show no major difference in barrier height; however, a significant difference is observed near the membrane center due to the lack of the slip-plane in tetraether membranes.
Figures


Similar articles
-
Liquid but durable: molecular dynamics simulations explain the unique properties of archaeal-like membranes.Sci Rep. 2014 Dec 12;4:7462. doi: 10.1038/srep07462. Sci Rep. 2014. PMID: 25501042 Free PMC article.
-
A molecular dynamics study of an archaeal tetraether lipid membrane: comparison with a dipalmitoylphosphatidylcholine lipid bilayer.Lipids. 2005 Oct;40(10):1023-30. doi: 10.1007/s11745-005-1465-2. Lipids. 2005. PMID: 16382574
-
Molecular dynamics simulation study of the effect of glycerol dialkyl glycerol tetraether hydroxylation on membrane thermostability.Biochim Biophys Acta Biomembr. 2017 May;1859(5):966-974. doi: 10.1016/j.bbamem.2017.02.009. Epub 2017 Feb 16. Biochim Biophys Acta Biomembr. 2017. PMID: 28214513
-
Continuum simulations of biomembrane dynamics and the importance of hydrodynamic effects.Q Rev Biophys. 2011 Nov;44(4):391-432. doi: 10.1017/S0033583511000047. Epub 2011 Jul 1. Q Rev Biophys. 2011. PMID: 21729348 Review.
-
Lipid lateral diffusion and membrane heterogeneity.Biochim Biophys Acta. 2009 Jan;1788(1):234-44. doi: 10.1016/j.bbamem.2008.08.016. Epub 2008 Sep 6. Biochim Biophys Acta. 2009. PMID: 18805393 Review.
Cited by
-
Microbial membrane lipid adaptations to high hydrostatic pressure in the marine environment.Front Mol Biosci. 2023 Jan 6;9:1058381. doi: 10.3389/fmolb.2022.1058381. eCollection 2022. Front Mol Biosci. 2023. PMID: 36685280 Free PMC article. Review.
-
Effects of Cholesterol on Water Permittivity of Biomimetic Ion Pair Amphiphile Bilayers: Interplay between Membrane Bending and Molecular Packing.Int J Mol Sci. 2019 Jul 2;20(13):3252. doi: 10.3390/ijms20133252. Int J Mol Sci. 2019. PMID: 31269714 Free PMC article.
-
Importance of Hydrophilic Groups on Modulating the Structural, Mechanical, and Interfacial Properties of Bilayers: A Comparative Molecular Dynamics Study of Phosphatidylcholine and Ion Pair Amphiphile Membranes.Int J Mol Sci. 2018 May 23;19(6):1552. doi: 10.3390/ijms19061552. Int J Mol Sci. 2018. PMID: 29882873 Free PMC article.
-
Characterisation of a synthetic Archeal membrane reveals a possible new adaptation route to extreme conditions.Commun Biol. 2021 Jun 2;4(1):653. doi: 10.1038/s42003-021-02178-y. Commun Biol. 2021. PMID: 34079059 Free PMC article.
-
Patterning Microtubule Network Organization Reshapes Cell-Like Compartments.ACS Synth Biol. 2021 Jun 18;10(6):1338-1350. doi: 10.1021/acssynbio.0c00575. Epub 2021 May 14. ACS Synth Biol. 2021. PMID: 33988978 Free PMC article.
References
-
- De Rosa, M., and A. Gambacorta. 1988. The lipids of archaebacteria. Prog. Lipid Res. 27:153–175. - PubMed
-
- Gambacorta, A., A. Trincone, B. Nicolaus, L. Lama, and M. De Rosa. 1994. Unique features of lipids of archaea. Syst. Appl. Microbiol. 16:518–527.
-
- Sprott, G. D. 1992. Structures of archeabacteria membrane lipids. J. Bioenerg. Biomembr. 24:555–566. - PubMed
-
- Benvegnu, T., M. Brard, and D. Plusquellec. 2004. Archaeabacteria bipolar lipid analogues: structure, synthesis and lyotropic properties. Curr. Opinion Colloid Interf. Sci. 8:469–479.
-
- Cuccia, L. A., F. Morin, A. Beck, N. Hebert, G. Just, and R. B. Lennox. 2000. Spanning or looping? The order and conformation of bipolar phospholipids in lipid membranes using 2H NMR spectroscopy. Chemistry. 6:4379–4384. - PubMed
Publication types
MeSH terms
Substances
LinkOut - more resources
Full Text Sources
Other Literature Sources
Miscellaneous

