. 2005 Aug 12;33(14):4563-77.
doi: 10.1093/nar/gki767. Print 2005.

Using multiple alignments to improve seeded local alignment algorithms

Affiliations

Using multiple alignments to improve seeded local alignment algorithms

Jason Flannick et al. Nucleic Acids Res. .

Abstract

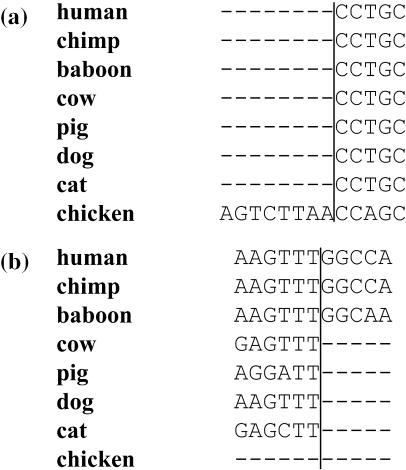
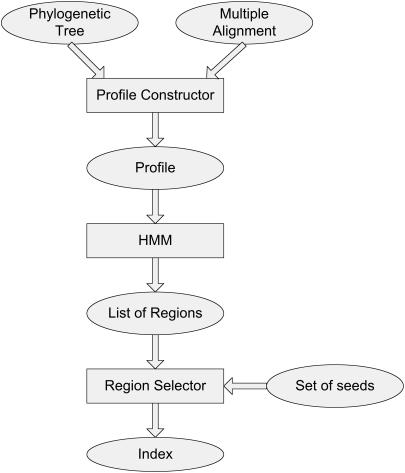
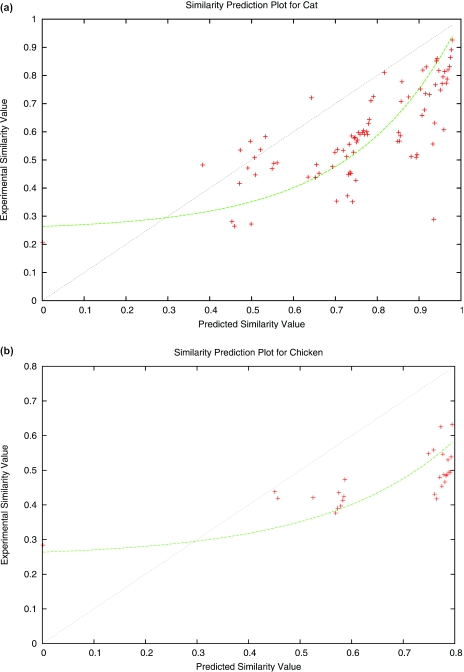
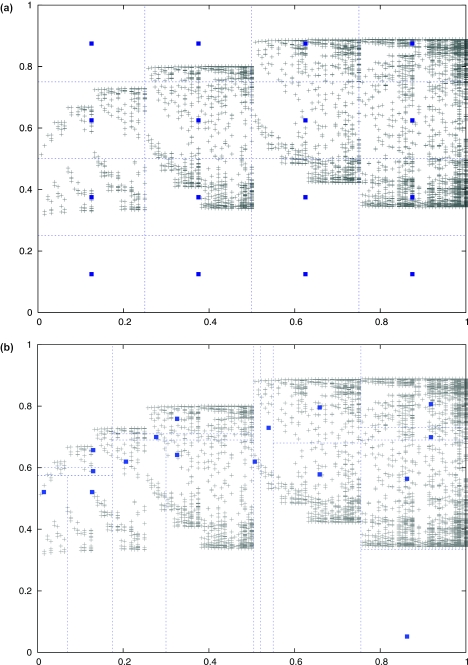
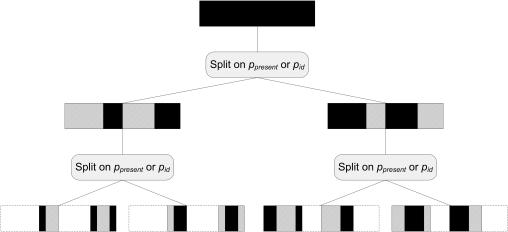
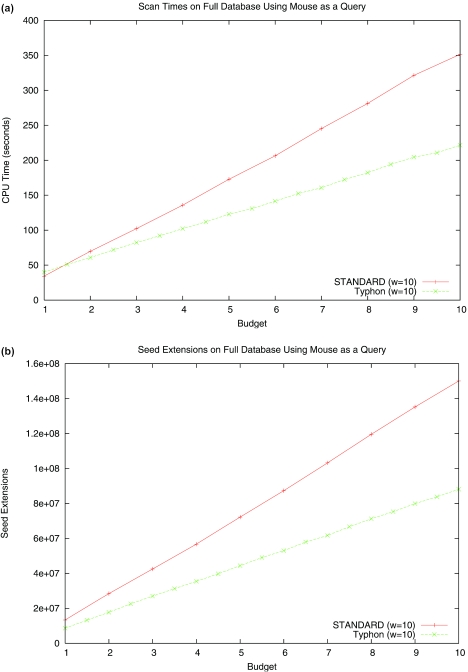
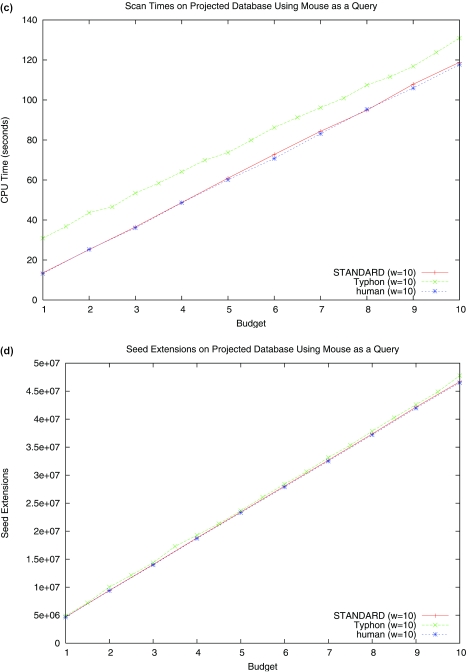
Multiple alignments among genomes are becoming increasingly prevalent. This trend motivates the development of tools for efficient homology search between a query sequence and a database of multiple alignments. In this paper, we present an algorithm that uses the information implicit in a multiple alignment to dynamically build an index that is weighted most heavily towards the promising regions of the multiple alignment. We have implemented Typhon, a local alignment tool that incorporates our indexing algorithm, which our test results show to be more sensitive than algorithms that index only a sequence. This suggests that when applied on a whole-genome scale, Typhon should provide improved homology searches in time comparable to existing algorithms.


Figures

Figure 1
Figure 1
Sample region boundaries. Boundaries between the two regions in the multiple alignment reflect the changes in conservation among the species in the alignment. Both (a) and (b) are taken from real data. In the first case, the latter region is more likely to yield alignments to a query sequence, while in the second case, the former region is more likely to yield alignments.
Figure 2
Figure 2
High-level diagram of the Typhon algorithm for indexing a multiple alignment. The overall flow of Typhon consists of three main algorithmic components; above, data is shown in ovals and methods are shown in rectangles. Given a tree and query, the multiple alignment is first converted into a probabilistic profile. Then, the profile is decoded recursively using a simple Hidden Markov Model. Finally, the regions are assigned a set of seeds to index.
Figure 3
Figure 3
Plots of predicted versus experimental profile values. For use in correcting predictions of profile values, we plotted predicted versus experimental values of (a) pid for cat and (b) pid for chicken. Although not shown, we examined plots for other species, which are similar. Plots for ppresent did not obey an immediate pattern and thus did not lead us to change our predictions. Each cross represents a plotted data point; shown also is the function we used for converting our initial predictions of pid to our final predictions, as well as the linear fit that would be suitable if our predictions matched the experimental values.
Figure 4
Figure 4
Alternative decomposition of the profile into region classes; region classes can be determined from a profile in several ways. Each cross represents a position in the profile plotted as a point (ppresent, pid). The squares represent the region class values Ppresent¯, Pid¯, and the lines roughly delineate portions of the plane that are closest to a particular region class. (a) When the set of region classes is fixed, the resulting decomposition does not always capture the structure of the profile. In this case, five out of sixteen region classes contain almost no positions and the region class values do not necessarily represent the average profile values of all positions in the region class. (b) An adaptive decomposition can adjust based on the structure of the profile. Here, only one out of sixteen classes contains few positions; the remaining can be distributed to help refine the region of space where most points lie. Furthermore, the region class values more accurately represent the positions in the region class. Note that the goal of this partitioning algorithm is not to cluster points, but to generate a set of region classes that each contain similar number of positions.
Figure 5
Figure 5
High-level outline of our algorithm for decoding the profile. The algorithm we use for decoding the probabilistic profile into a set of regions consists of a series of recursive stages. At each level, we choose to partition the portion of the profile shown in black into two different region classes that differ either in Ppresent¯ or Pid¯. We then recursively split each of the two classes until we have partitioned the profile into enough different region classes.
Figure 6
Figure 6
Running time and seed extension comparison of indexing algorithms. The performance of both Typhon and STANDARD is highly data dependent. Above are plots of scan times as database size is varied. In all tests using alignment databases the alignment consisted of baboon, cat, chicken, chimp, cow, dog, human and pig. We used mouse as a query and seed weights of 10. Tests were run on a 2.8 GHz Pentium 4 processor with 2 GB of RAM. (a) CPU time spent scanning the index and (b) seed extensions performed when using the full alignment (4.2 Mbp) as an index are shown, as well as (c) CPU time spent scanning the index and (d) seed extensions performed when using the projected alignment (1.8 Mbp) as an index. Shown also is performance while scanning a database consisting of solely the human sequence, which is the same length as the projected alignment.
Figure 6
Figure 6
Running time and seed extension comparison of indexing algorithms. The performance of both Typhon and STANDARD is highly data dependent. Above are plots of scan times as database size is varied. In all tests using alignment databases the alignment consisted of baboon, cat, chicken, chimp, cow, dog, human and pig. We used mouse as a query and seed weights of 10. Tests were run on a 2.8 GHz Pentium 4 processor with 2 GB of RAM. (a) CPU time spent scanning the index and (b) seed extensions performed when using the full alignment (4.2 Mbp) as an index are shown, as well as (c) CPU time spent scanning the index and (d) seed extensions performed when using the projected alignment (1.8 Mbp) as an index. Shown also is performance while scanning a database consisting of solely the human sequence, which is the same length as the projected alignment.

Similar articles

Cited by

References

    1. Cooper G.M., Brudno M., Stone E.A., Dubchak I., Batzoglou S., Sidow A. Characterization of evolutionary rates and constraints in three mammalian genomes. Genome Res. 2004;14:539–548. - PMC - PubMed
    1. Kent W.J., Baertsch R., Hinrichs A., Miller W., Haussler D. Evolution's cauldron: duplication, deletion, and rearrangement in the mouse and human genomes. Proc. Natl Acad. Sci. USA. 2003;100:11484–11489. - PMC - PubMed
    1. Pevzner P., Tesler G. Genome rearrangements in mammalian evolution: lessons from human and mouse genomes. Genome Res. 2003;13:37–45. - PMC - PubMed
    1. Schwartz S., Kent W.J., Smit A., Zhang Z., Baertsch R., Hardison R.C., Haussler D., Miller D. Human-mouse alignments with BLASTZ. Genome Res. 2003;13:103–107. - PMC - PubMed
    1. Waterston R.H., Lindblad-Toh K., Birney E., Rogers J., Abril J.F., Agarwal P., Agarwala R., Ainscough R., Alexandersson M., An P., et al. Initial sequencing and comparative analysis of the mouse genome. Nature. 2002;420:520–562. - PubMed

Publication types