Distributions of antibody titers to Mycoplasma pneumoniae in Korean children in 2000-2003
- PMID: 16100441
- PMCID: PMC2782145
- DOI: 10.3346/jkms.2005.20.4.542
Distributions of antibody titers to Mycoplasma pneumoniae in Korean children in 2000-2003
Abstract
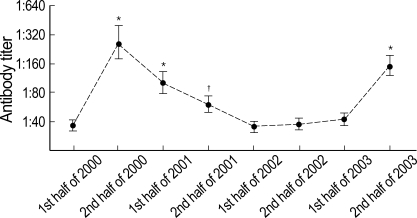
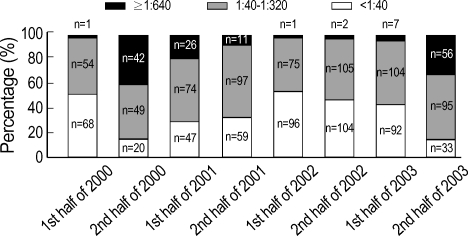
The aim of study was to describe Mycoplasma pneumoniae epidemics in a hospital-based population. Special attention was paid to the relationship between antibody titer to M. pneumoniae and sex, age, and atopy. During the eight 6-month periods between January 2000 and December 2003, serum samples were obtained from 1,319 Korean children who presented with respiratory symptoms, and were examined for antibodies to M. pneumoniae using the indirect particle agglutination test. Geometric mean antibody titers peaked in the second half of 2000 and then decreased gradually, a second peak occurred in the second half of 2003. Likewise, the frequency of high antibody titers (> or =1:640) also peaked during these two periods. Antibody titers in children aged 0-3 yr were lower than in older children during both peak periods and for 2 yr after the first peak. Sex and atopy had no effect on antibody titers. During the years 2000-2003, geometric mean antibody titers and the frequencies of high antibody titers varied with time. These changes suggest a cyclic pattern of M. pneumoniae infection, with two epidemic peaks separated by 3 yr.
Figures
References
-
- Atmar RL, Greenberg SB. Pneumonia caused by Mycoplasma pneumoniae and the TWAR agent. Semin Respir Infect. 1989;4:19–31. - PubMed
-
- Lind K, Benzon MW, Jensen JS, Clyde WA., Jr A seroepidemiological study of Mycoplasma pneumoniae infections in Denmark over the 50-year period 1946-1995. Eur J Epidemiol. 1997;13:581–586. - PubMed
-
- Foy HM, Kenny GE, Cooney MK, Allan ID. Long-term epidemiology of infections with Mycoplasma pneumoniae. J Infect Dis. 1979;139:681–687. - PubMed
-
- Foy HM, Kenny GE, McMahan R, Mansy AM, Grayston JT. Mycoplasma pneumoniae pneumonia in an urban area. Five years of surveillance. JAMA. 1970;214:1666–1672. - PubMed
Publication types
MeSH terms
Substances
LinkOut - more resources
Full Text Sources