. 2005 Sep;115(9):2489-98.
doi: 10.1172/JCI25614. Epub 2005 Aug 11.

Schoenheimer effect explained--feedback regulation of cholesterol synthesis in mice mediated by Insig proteins

Affiliations

Schoenheimer effect explained--feedback regulation of cholesterol synthesis in mice mediated by Insig proteins

Luke J Engelking et al. J Clin Invest. 2005 Sep.

Abstract

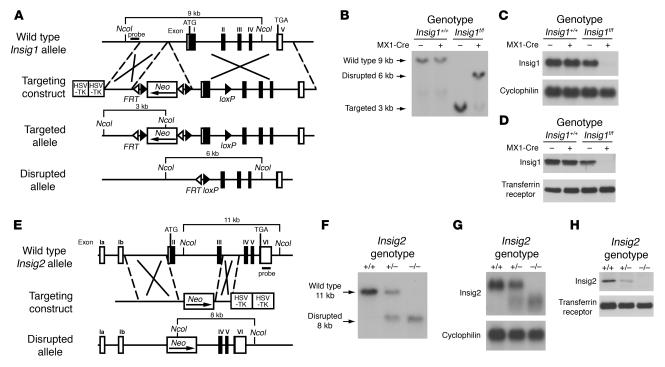
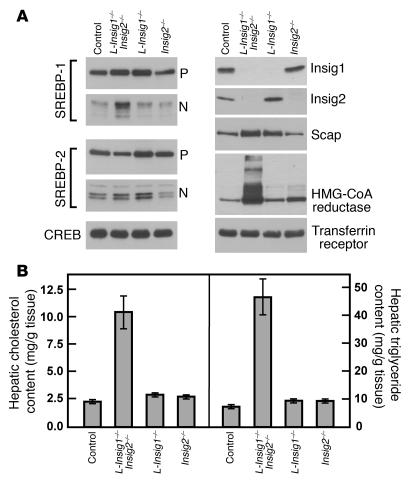
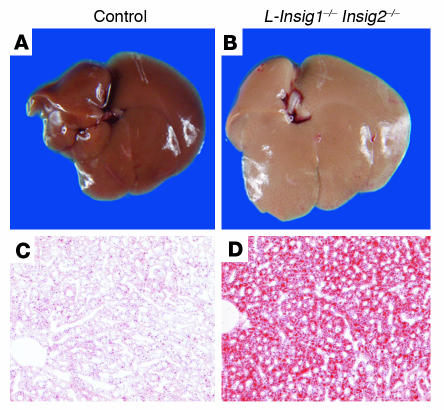
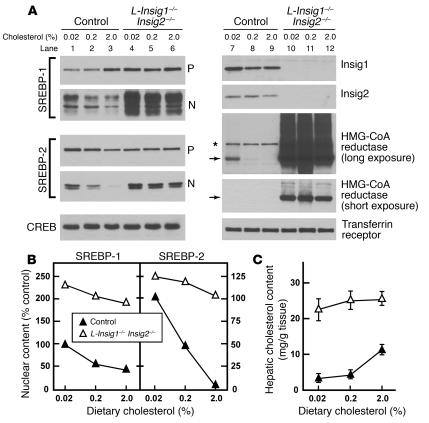
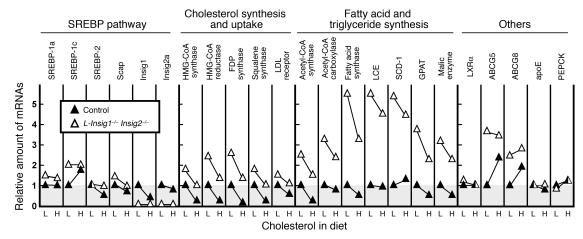
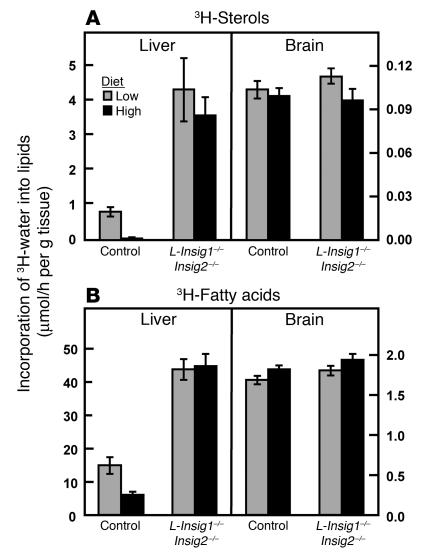
End-product feedback inhibition of cholesterol synthesis was first demonstrated in living animals by Schoenheimer 72 years ago. Current studies define Insig proteins as essential elements of this feedback system in mouse liver. In cultured cells, Insig proteins are required for sterol-mediated inhibition of the processing of sterol regulatory element-binding proteins (SREBPs) to their nuclear forms. We produced mice with germline disruption of the Insig2 gene and Cre-mediated disruption of the Insig1 gene in liver. On a chow diet, these double-knockout mice overaccumulated cholesterol and triglycerides in liver. Despite this accumulation, levels of nuclear SREBPs and mRNAs for SREBP target genes in lipogenic pathways were not reduced. Whereas cholesterol feeding reduced nuclear SREBPs and lipogenic mRNAs in wild-type mice, this feedback response was severely blunted in the double-knockout mice, and synthesis of cholesterol and fatty acids was not repressed. The amount of HMG-CoA reductase protein was elevated out of proportion to the mRNA in the double-knockout mice, apparently owing to the failure of cholesterol to accelerate degradation of the enzyme. These studies indicate that the essential elements of the regulatory pathway for lipid synthesis function in liver as they do in cultured cells.


Figures

Figure 1
Figure 1
Targeted disruption of Insig1 and Insig2 genes in mice. (A) Schematic of Insig1 gene-targeting strategy. Cre-mediated excision of the sequences between loxP sites deletes exon 1. The location of the probe used for Southern blot analysis is denoted by the horizontal filled rectangle labeled “probe.” (B) Representative Southern blot analysis of NcoI-digested DNA from livers of mice with the indicated genotypes that were treated with 4 intraperitoneal injections of pIpC (300 μg/injection). (C) Northern blot analysis of hepatic RNA of mice indicated in B. Total RNA from liver was pooled, and 20-μg aliquots were subjected to electrophoresis and blot hybridization with 32P-labeled cDNA probes for mouse Insig1 and mouse cyclophilin. (D) Immunoblot analysis of livers of mice indicated in B. Liver membrane fractions were prepared as described in Methods, and aliquots (45 μg) were subjected to SDS-PAGE and immunoblot analysis. (E) Schematic of Insig2 gene-targeting strategy. The Insig2 allele was disrupted by replacement of exons II and III of the Insig2 gene with a polIIsneopA expression cassette. The DNA probe used for Southern blot analysis is denoted by the horizontal filled rectangle labeled “probe.” (F) Representative Southern blot analysis of NcoI-digested tail DNA of the offspring from mating of Insig2+/− mice. (G) Northern blot analysis of hepatic RNA of mice described in F. Total RNA from livers of mice was subjected to electrophoresis and blot hybridization with 32P-labeled cDNA probes for mouse Insig2 and mouse cyclophilin. (H) Immunoblot analysis of liver membranes from mice with the indicated Insig2 genotype, as described above.
Figure 2
Figure 2
Immunoblot (A) and lipid analysis (B) of livers from control and Insig-deficient mice. The mice used in this figure are the same as those compared in Table 2. (A) Immunoblot analysis from nuclear extract and membrane fractions obtained from mice with the following 4 genotypes: (a) Insig1f/f (designated control); (b) Insig1f/fInsig2−/−MX1-Cre (designated L-Insig1–/–Insig2–/–); (c) Insig1f/fMX1-Cre (designated L-Insig1–/–); and (d) Insig1f/fInsig2–/– (designated Insig2–/–). Each mouse was treated with 4 intraperitoneal injections of pIpC (300 μg/injection), and tissues were obtained 14 days after the final injection. Livers (n = 6) were separately pooled, and 45-μg aliquots of the pooled membrane and nuclear extract fractions were subjected to SDS-PAGE and immunoblot analysis. CREB protein and the transferrin receptor were used in the immunoblots as loading controls for the nuclear extract and membrane fractions, respectively. P, pSREBP; N, nSREBP. (B) Hepatic cholesterol and triglyceride content of control and Insig-deficient livers. Each bar represents the mean ± SEM of data from 6 mice.
Figure 3
Figure 3
Lipid accumulation in livers of L-Insig1–/–Insig2–/– mice. Adult female mice were treated with 4 intraperitoneal injections of pIpC (300 μg/injection), and the livers were removed either 12 days (A and B) or 7 days (C and D) after the final injection. (A and B) Photographs of livers from chow-fed control and L-Insig1–/–Insig2–/– mice. (C and D) Oil red O–stained histologic sections of the livers from chow-fed control (left) and L-Insig1–/–Insig2–/– mice. Mice were perfused through the heart with HBSS and then with 10% (v/v) formalin in PBS; frozen sections of livers were stained with oil red O. Magnification, ×20.
Figure 4
Figure 4
Markedly elevated levels of nSREBPs and HMG-CoA reductase in the livers of Insig-deficient mice fed high-cholesterol diets. The mice used for this figure are the same as those compared in Table 4. Each mouse was treated with 4 intraperitoneal injections of pIpC (300 μg/injection); 8.5 day after the final injection, mice were fed ad libitum a chow diet containing the indicated amount of cholesterol for 2.5 days prior to study. (A) Immunoblot analysis of SREBP-1 and SREBP-2 from livers of control and L-Insig1–/–Insig2–/– mice fed with the indicated amount of cholesterol. Livers (4 or 6 per group) were separately pooled, and 45-μg aliquots of the membrane and nuclear extract fractions were subjected to SDS-PAGE and immunoblot analysis. Nonspecific bands are denoted by the asterisk. Arrows indicate the position of migration on SDS gels of monomeric HMG-CoA reductase (97 kDa). Immunoblots of CREB and transferrin receptor were used as loading controls for the nuclear extract and membrane fractions, respectively. (B) The gels of nuclear extract fractions (nuclear) shown in A were scanned and quantified by densitometry. The intensities of cleaved nSREBP-1 and nSREBP-2 in lane 1 (control mice fed with 0.02% cholesterol) were arbitrarily set at 100%. (C) Hepatic cholesterol content of control and Insig-deficient mice. Each value represents the mean ± SEM of data from 4 or 6 mice.
Figure 5
Figure 5
Relative amounts of various mRNAs in livers from control and L-Insig1–/–Insig2–/– mice fed with diets containing a low (L) or high (H) amount of cholesterol (0.02% or 2.0% cholesterol, respectively). The mice used here are the same as those used for Figure 4 and Table 4. Total RNA from livers of mice was pooled and subjected to real-time PCR quantification as described in Methods. Each value represents the amount of mRNA relative to that in the control mice fed with a chow diet (0.02% cholesterol), which is arbitrarily defined as 1. LCE, long-chain fatty acyl–CoA elongase; SCD-1, stearoyl-CoA desaturase-1; GPAT, glycerol-3-phosphate acyltransferase; PEPCK, phosphoenolpyruvate carboxykinase.
Figure 6
Figure 6
In vivo synthesis rates of sterols (A) and fatty acids (B) in livers and brains from control and L-Insig1–/–Insig2–/– mice. Mice (20- to 24-week-old males; 5 or 6 per group) were treated with 4 intraperitoneal injections of pIpC (300 μg/injection). Five and a half days after the final injection, mice were fed ad libitum a chow diet containing 0.02% (low) or 1.5% (high) cholesterol for 2.5 days prior to sacrifice, at which time the mice were injected intraperitoneally with 3H-labeled water (50-mCi in 0.20 ml of isotonic saline). One hour later the tissues were removed for measurement of 3H-labeled fatty acids and digitonin-precipitable sterols. Each bar represents the mean ± SEM of the values from 5 or 6 mice.

Similar articles

Cited by

References

    1. Schoenheimer R, Breusch F. Synthesis and destruction of cholesterol in the organism. J. Biol. Chem. 1933;103:439–448.
    1. Gould RG. Lipid metabolism and atherosclerosis. Am. J. Med. 1951;11:209–227. - PubMed
    1. Gould RG, Taylor CB, Hagerman JS, Warner I, Campbell DJ. Cholesterol metabolism. I. Effect of dietary cholesterol on the synthesis of cholesterol in dog tissue in vitro. J. Biol. Chem. 1953;201:519–523. - PubMed
    1. Brown MS, Goldstein JL. Multivalent feedback regulation of HMG CoA reductase, a control mechanism coordinating isoprenoid synthesis and cell growth. J. Lipid Res. 1980;21:505–517. - PubMed
    1. Brown MS, Goldstein JL. The SREBP pathway: regulation of cholesterol metabolism by proteolysis of a membrane-bound transcription factor [review] Cell. 1997;89:331–340. - PubMed

Publication types

MeSH terms