

Evaluation of the profile of thrombin generation during the process of whole blood clotting as assessed by thrombelastography
- PMID: 16102110
- PMCID: PMC1410193
- DOI: 10.1111/j.1538-7836.2005.01513.x
Evaluation of the profile of thrombin generation during the process of whole blood clotting as assessed by thrombelastography
Abstract
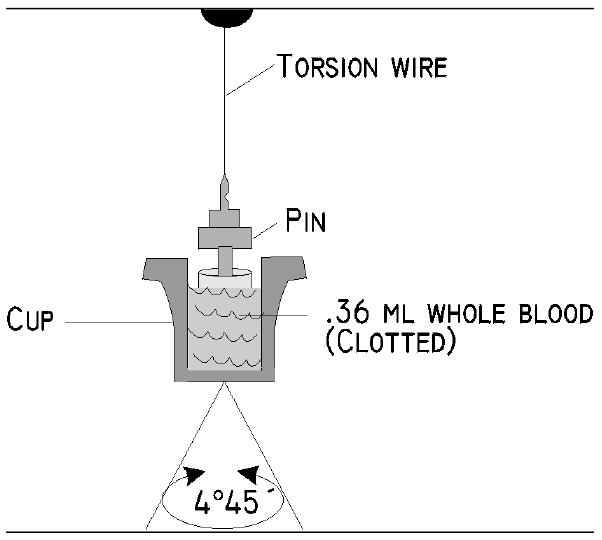
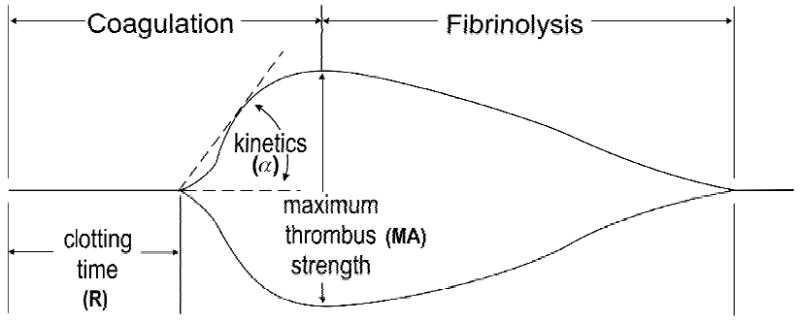
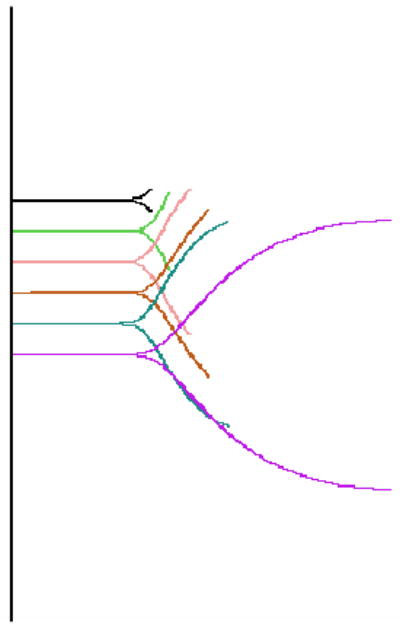
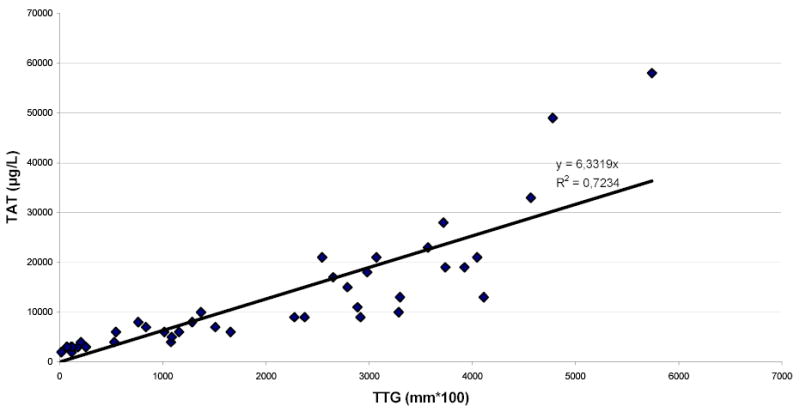
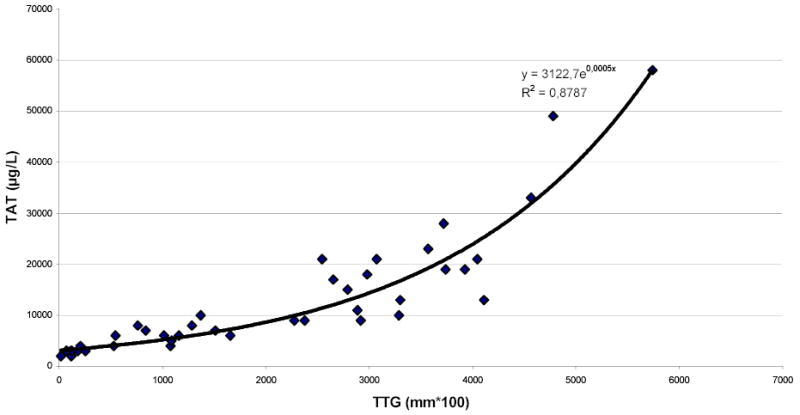
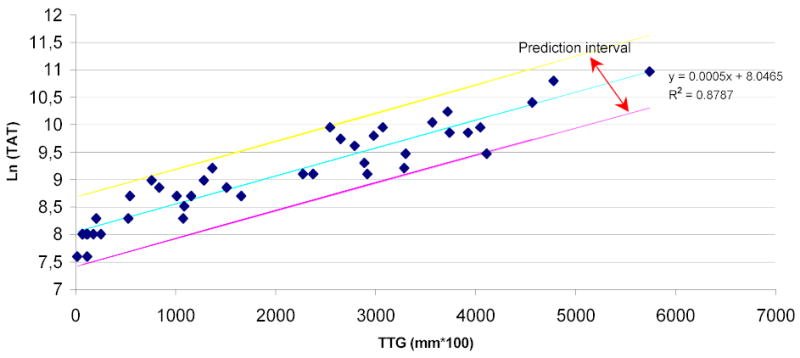
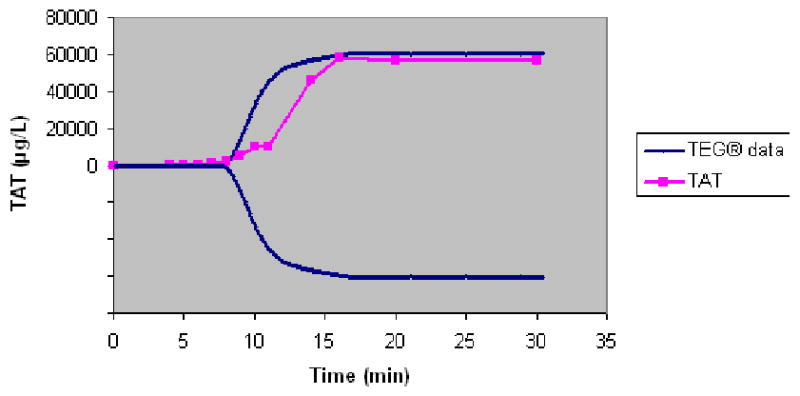
The objective of this study was to evaluate the possibility of linking the tracing of whole blood clotting in a thrombelastograph (TEG) hemostasis system with the generation of thrombin assessed by thrombin/antithrombin complex (TAT). Citrated whole blood containing corn trypsin inhibitor from volunteers was clotted in the presence of CaCl2 and tissue factor. Clotting was monitored with the eight channels of a TEG system. At different time points, the whole blood TEG reaction cups were kept in a cold quenching solution, centrifuged, and the supernatants were kept at -80 degrees C until assayed for TAT by ELISA. The total thrombus generation (TTG) was calculated from the first derivative of the TEG waveform and was compared with thrombin generation measured by TAT. The two vector values--the TAT thrombin generation data and the corresponding TEG TTG--were analyzed using Pearson correlation coefficients (r) and linear, non-linear and natural log (ln) transformation of TAT values for least-squares goodness-of-fit curves. The best least-squares fit is an exponential curve. Linearizing using the ln of the TAT thrombin generation variable produces the same r (0.94) as of the exponential curve. The prediction equation is y = 8.0465 + 0.0005x (P < or = 0.0001), where y is the TAT thrombin generation variable in the ln transformation and x is the TEG TTG variable. The high magnitude of r and the high significance of the prediction equation demonstrate the high efficacy of the prediction of TAT thrombin generation by the use of TEG TTG.
Figures

References
-
- Lee RI, White PD. A clinical study of the coagulation time of blood. Am J Med Sci. 1913;145:495–503.
-
- Proctor RR, Rapaport SI. The partial thromboplastin time with kaolin. Am J Clin Pathol. 1961;36:212–2190. - PubMed
-
- Yamada K, Meguro T. A new APTT assay employing a chromogenic substrate and a centrifugal autoanalyser. Thromb Res. 1979;15:351–358. - PubMed
-
- Hemker HC, Beguin S. Thrombin generation in plasma: its assessment via the endogenous thrombin potential. Thromb Haemost. 1995;74:134–138. - PubMed
-
- Rand MD, Lock JB, ven’t Veer C, Gaffney DP, Mann KG. Blood clotting in minimally altered whole blood. Blood. 1996;88:3432–3445. - PubMed
Publication types
MeSH terms
Substances
Grants and funding
LinkOut - more resources
Full Text Sources
Other Literature Sources
