

Contrast adaptation and representation in human early visual cortex
- PMID: 16102542
- PMCID: PMC1475737
- DOI: 10.1016/j.neuron.2005.07.016
Contrast adaptation and representation in human early visual cortex
Abstract
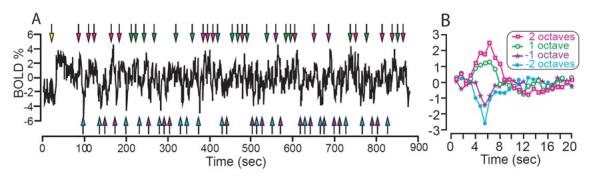
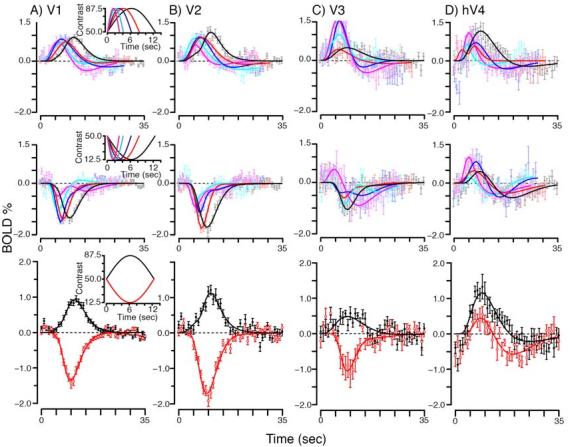
The human visual system can distinguish variations in image contrast over a much larger range than measurements of the static relationship between contrast and response in visual cortex would suggest. This discrepancy may be explained if adaptation serves to re-center contrast response functions around the ambient contrast, yet experiments on humans have yet to report such an effect. By using event-related fMRI and a data-driven analysis approach, we found that contrast response functions in V1, V2, and V3 shift to approximately center on the adapting contrast. Furthermore, we discovered that, unlike earlier areas, human V4 (hV4) responds positively to contrast changes, whether increments or decrements, suggesting that hV4 does not faithfully represent contrast, but instead responds to salient changes. These findings suggest that the visual system discounts slow uninformative changes in contrast with adaptation, yet remains exquisitely sensitive to changes that may signal important events in the environment.
Figures


Comment in
-
Contrast gain in the brain.Neuron. 2005 Aug 18;47(4):476-7. doi: 10.1016/j.neuron.2005.08.003. Neuron. 2005. PMID: 16102529 Review.
Similar articles
-
Neural adjustments to image blur.Nat Neurosci. 2002 Sep;5(9):839-40. doi: 10.1038/nn906. Nat Neurosci. 2002. PMID: 12195427
-
Stimulus predictability reduces responses in primary visual cortex.J Neurosci. 2010 Feb 24;30(8):2960-6. doi: 10.1523/JNEUROSCI.3730-10.2010. J Neurosci. 2010. PMID: 20181593 Free PMC article.
-
Orientation-tuned FMRI adaptation in human visual cortex.J Neurophysiol. 2005 Dec;94(6):4188-95. doi: 10.1152/jn.00378.2005. Epub 2005 Aug 24. J Neurophysiol. 2005. PMID: 16120668
-
Selective visual responses to expansion and rotation in the human MT complex revealed by functional magnetic resonance imaging adaptation.Eur J Neurosci. 2008 May;27(10):2747-57. doi: 10.1111/j.1460-9568.2008.06249.x. Eur J Neurosci. 2008. PMID: 18547254
-
A few observations on linking VEP responses to the magno- and parvocellular systems by way of contrast-response functions.Int J Psychophysiol. 2014 Mar;91(3):147-54. doi: 10.1016/j.ijpsycho.2014.01.005. Epub 2014 Jan 15. Int J Psychophysiol. 2014. PMID: 24440598 Review.
Cited by
-
Occipital transcranial magnetic stimulation has an activity-dependent suppressive effect.J Neurosci. 2012 Sep 5;32(36):12361-5. doi: 10.1523/JNEUROSCI.5864-11.2012. J Neurosci. 2012. PMID: 22956826 Free PMC article. Clinical Trial.
-
Transcranial Magnetic Stimulation Changes Response Selectivity of Neurons in the Visual Cortex.Brain Stimul. 2015 May-Jun;8(3):613-23. doi: 10.1016/j.brs.2015.01.407. Epub 2015 Jan 24. Brain Stimul. 2015. PMID: 25862599 Free PMC article.
-
The relative contributions of visual and semantic information in the neural representation of object categories.Brain Behav. 2019 Oct;9(10):e01373. doi: 10.1002/brb3.1373. Epub 2019 Sep 27. Brain Behav. 2019. PMID: 31560175 Free PMC article.
-
What has vision science taught us about functional MRI?Neuroimage. 2022 Nov 1;261:119536. doi: 10.1016/j.neuroimage.2022.119536. Epub 2022 Aug 3. Neuroimage. 2022. PMID: 35931310 Free PMC article.
-
fMRI repetition suppression: neuronal adaptation or stimulus expectation?Cereb Cortex. 2012 Mar;22(3):567-76. doi: 10.1093/cercor/bhr119. Epub 2011 Jun 20. Cereb Cortex. 2012. PMID: 21690262 Free PMC article.
References
-
- Adorjan P, Piepenbrock C, Obermayer K. Contrast adaptation and infomax in visual cortical neurons. Rev Neurosci. 1999;10:181–200. - PubMed
-
- Albrecht DG, Hamilton DB. Striate cortex of monkey and cat: contrast response function. J Neurophysiol. 1982;48:217–237. - PubMed
-
- Allison JD, Casagrande VA, Debruyn EJ, Bonds AB. Contrast adaptation in striate cortical neurons of the nocturnal primate bush baby (Galago crassicaudatus) Vis Neurosci. 1993;10:1129–1139. - PubMed
-
- Anzai A, Bearse MA, Jr., Freeman RD, Cai D. Contrast coding by cells in the cat's striate cortex: monocular vs. binocular detection. Vis Neurosci. 1995;12:77–93. - PubMed
MeSH terms
Grants and funding
LinkOut - more resources
Full Text Sources
Other Literature Sources
