Review
. 2005:87:163-208.
doi: 10.1016/S0065-2776(05)87005-1.

The biology of human lymphoid malignancies revealed by gene expression profiling

Affiliations
Review

The biology of human lymphoid malignancies revealed by gene expression profiling

Louis M Staudt et al. Adv Immunol. 2005.

Abstract

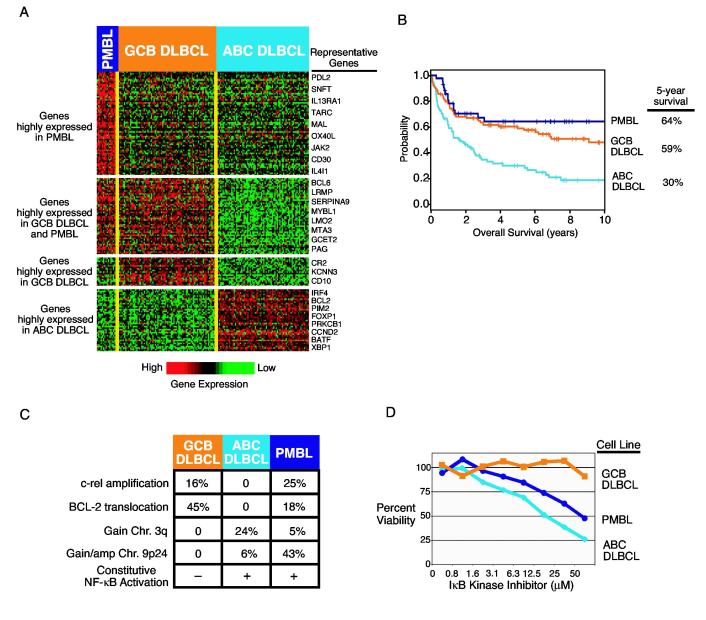
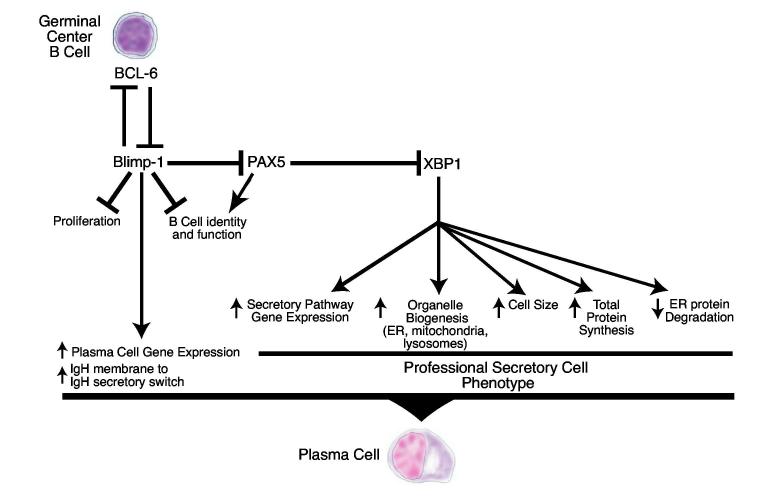
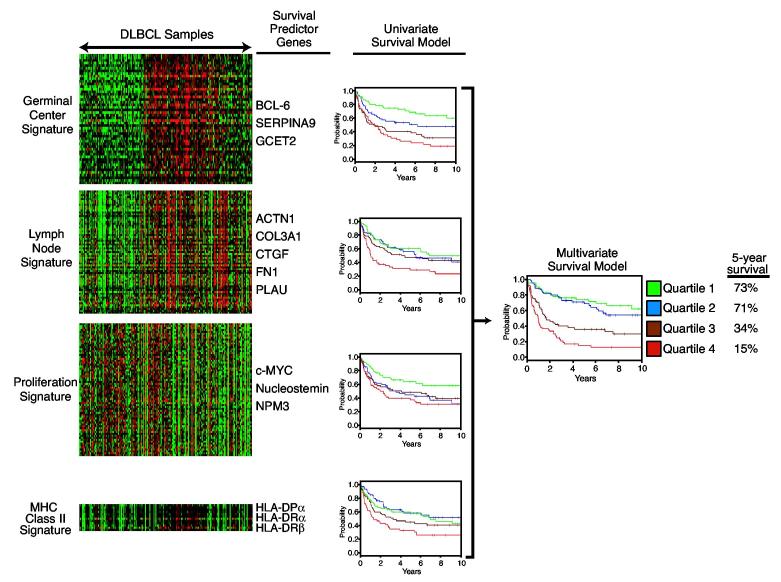
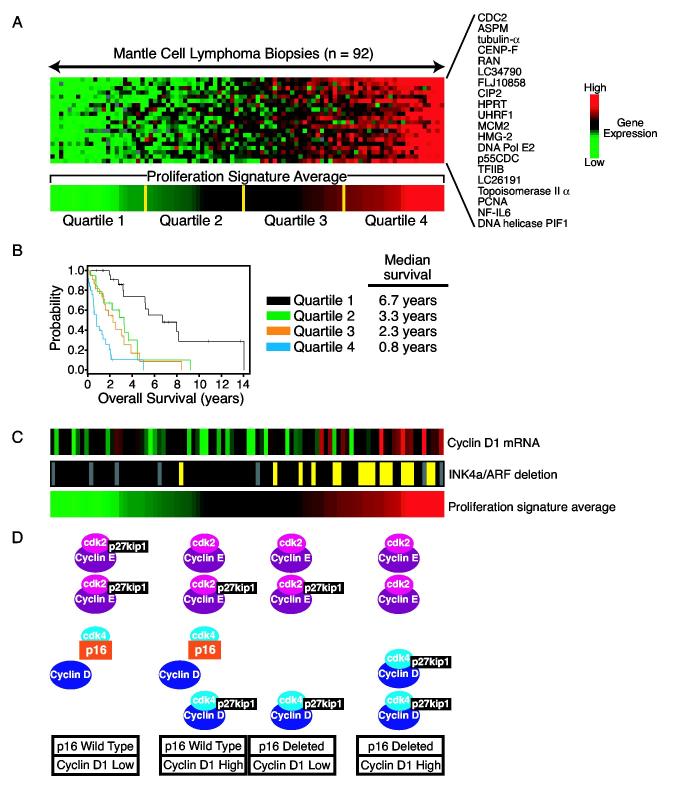
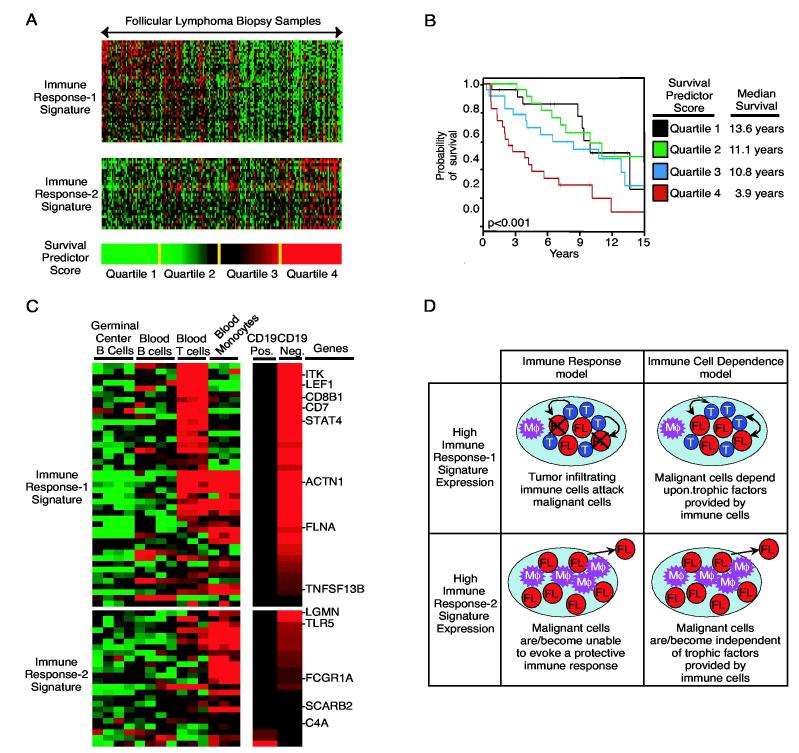
Gene expression profiling provides a quantitative molecular framework for the study of human lymphomas. This genomic technology has revealed that existing diagnostic categories are comprised of multiple molecularly and clinically distinct diseases. Diffuse large B-cell lymphoma (DLBCL), for example, consists of three gene expression subgroups, termed germinal center B-cell-like (GCB) DLBCL, activated B-cell-like (ABC) DLBCL, and primary mediastinal B-cell lymphoma (PMBL). These DLBCL subgroups arise from different stages of normal B-cell differentiation, utilize distinct oncogenic mechanisms, and differ in their ability to be cured by chemotherapy. Key regulatory factors and their target genes are differentially expressed among these subgroups, including BCL-6, Blimp-1, and XBP1. ABC DLBCL and PMBL depend upon constitutive activation of the NF-kappaB pathway for their survival but GCB DLBCL does not, demonstrating that this pathway is a potential therapeutic target for certain DLBCL subgroups. In DLBCL, mantle cell lymphoma, and follicular lymphoma, gene expression profiling has also been used to create gene expression-based models of survival, which have identified the biological characteristics of the tumors that influence their clinical behavior. In mantle cell lymphoma, the length of survival following diagnosis is primarily influenced by the tumor proliferation rate, which can be quantitatively measured by a proliferation gene expression "signature." Based on this accurate measure, the proliferation rate can now be viewed as an integration of several oncogenic lesions that each increase progression from the G1 to the S phase of the cell cycle. In DLBCL and follicular lymphoma, gene expression profiling has revealed that the molecular characteristics of non-malignant tumor-infiltrating immune cells have a major influence on the length of survival. The implications of these insights for the diagnosis and treatment of non-Hodgkin lymphomas are discussed.


Figures

Figure 1.
Figure 1.
A. Genes characteristically expressed by three subgroups diffuse large B-cell lymphoma (DLBCL): Primary mediastinal B-cell lymphoma (PMBL), germinal center B-cell-like (GCB) DLBCL, and the activated B cell-like (ABC) DLBCL (Rosenwald et al.,2002;Rosenwald et al., 2003a;Wright et al., 2003). Each of the 201 columns represents gene expression data from a single DLBCL biopsy sample and each row represents expression of a single gene. Relative gene expression is indicated according to the color scale shown. B. Kaplan-Meier plot of overall survival for the different DLBCL subgroups. C. Distinct oncogenic mechanisms in the DLBCL subgroups. D. Selective toxicity of a small molecule IκB kinase inhibitor for ABC DLBCL and PMBL cell lines (Lam et al., 2004).
Figure 2.
Figure 2.
Schematic of the regulatory network governing differentiation of a germinal center B cell to a plasma cell.
Figure 3.
Figure 3.
A gene expression-based multivariate model of survival following chemotherapy for DLBCL. The left panel shows the expression of the four gene expression signatures used to create the survival model in 201 DLBCL biopsy samples. Expression of the germinal center, lymph node, and MHC class II signatures is associated favorable prognosis while expression of the proliferation signature is associated with poor prognosis (Rosenwald et al., 2002). Representative genes from each signature that were used to create the survival model are shown. For each signature, patients were divided into four equal quartiles based on the expression of the signature in their biopsy samples. The four Kaplan Meier plots in the center depict the survival of patients in each signature quartile. These four signatures were combined into a multivariate model of survival and patients were divided into four quartiles groups based on this model (Rosenwald et al., 2002). The Kaplan Meier plot at the right depicts the overall survival of each quartile group of the multivariate model.
Figure 4.
Figure 4.
A. Differential expression of proliferation signature genes in biopsy samples from mantle cell lymphoma. The expression patterns of 20 genes from the proliferation signature are shown across 92 mantle cell lymphoma biopsy samples. The expression of each of these genes was found to being associated with short survival (Rosenwald et al., 2003b). The expression levels of these 20 genes were averaged to create the proliferation signature average, which was divided into four quartile groups as shown. B. Kaplan Meier plot of overall survival of patients with mantle cell lymphoma,divided into four quartile groups according to the expression of the proliferation signature in their tumors. C. The proliferation signature integrates distinct oncogenic events in mantle cell lymphoma. The expression of the cyclin D1 mRNA was determined by a quantitative RT-PCR assay for the coding region. Deletion of the INK4a/ARF locus was determined by a quantitative PCR using genomic DNA. Yellow indicates heterozygous or homozygous deletion; black indicates wild type copy number. Tumors with higher expression of the proliferation signature tend to have higher cyclin D1 mRNA expression and or deletion of the INK4a/ARF locus. D. Model depicting how increased cyclin D1 expression and deletion of the INK4a/ARF locus may contribute to a higher proliferation rate in mantle cell lymphoma. See text for details.
Figure 5.
Figure 5.
A. Two sets of coordinately expressed genes, termed the immune response-1 and immune response-2 signatures, are associated with survival in follicular lymphoma. The expression pattern of each gene in these two signatures in shown for 191 follicular lymphoma biopsy samples. Expression of the immune response-1 signature is associated with long survival following diagnosis and expression of the immune response-2 signature is associated with short survival (Dave et al., 2004). These signatures are combined into a multivariate model of survival that generates a survival predictor score for each patient. Patients are ranked according to this survival predictor and divided into four equal quartiles as shown. B. Kaplan-Meier plot of overall survival of patients in the four quartiles of the survival predictor. C. Expression of the genes that constitute the immune response-1 and immune response-2 signatures in normal immune cells. Tonsillar germinal center B cells, peripheral blood B cells, peripheral blood T cells and peripheral blood monocytes from healthy donors were profiled for gene expression. C. Relative expression of the immune response-1 and immune response-2 signature genes in the malignant (CD19-positive) and the non-malignant (CD19-negative) cells isolated from follicular lymphoma biopsy samples is shown. D. A schematic of how the immune response hypothesis and immune cell dependence hypothesis might explain the clinical behavior of tumors with high expression of the immune response-1 signature or the immune response-2 signature (see text for details).

References

    1. Addis BJ, Isaacson PG. Histopathology. 1986;10:379. - PubMed
    1. Albagli O, Dhordain P, Bernardin F, Quief S, Kerkaert JP, Leprince D. Biochem Biophys Res Commun. 1996;220:911. - PubMed
    1. Alizadeh A, Eisen M, Davis RE, Ma C, Sabet H, Tran T, Powell J, Yang L, Marti G, Moore T, Hudson J, Chan WC, Greiner T, Weisenburger D, Armitage JO, Lossos I, Levy R, Botstein D, Brown PO, Staudt LM. Cold Spring Harbor Symp Quant Biol. 1999;64:71. - PubMed
    1. Alizadeh AA, Eisen MB, Davis RE, Ma C, Lossos IS, Rosenwald A, Boldrick JC, Sabet H, Tran T, Yu X, Powell JI, Yang L, Marti GE, Moore T, Hudson J, Lu L, Lewis DB, Tibshirani R, Sherlock G, Chan WC, Greiner TC, Weisenburger DD, Armitage JO, Warnke R, Levy R, Wilson W, Grever MR, Byrd JC, Botstein D, Brown PO, Staudt LM. Nature. 2000;403:503. - PubMed
    1. Allen LA, Aderem A. J Exp Med. 1996;184:627. - PMC - PubMed

MeSH terms