. 2005 Aug 15;65(16):7194-204.
doi: 10.1158/0008-5472.CAN-04-3434.

Combined immunostimulation and conditional cytotoxic gene therapy provide long-term survival in a large glioma model

Affiliations

Combined immunostimulation and conditional cytotoxic gene therapy provide long-term survival in a large glioma model

Sumia Ali et al. Cancer Res. .

Abstract

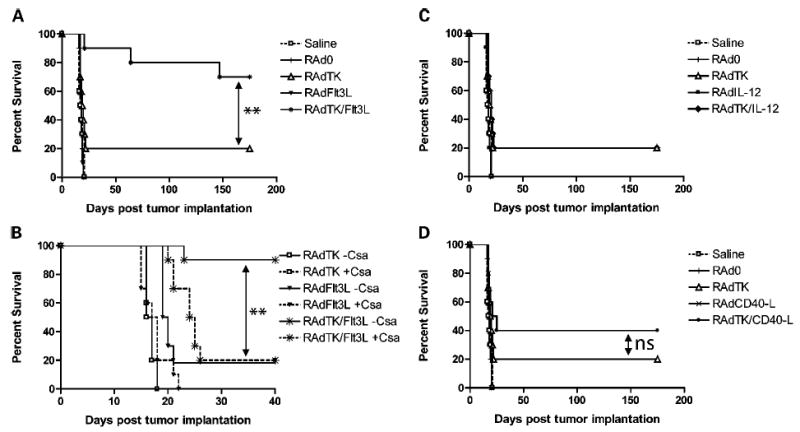
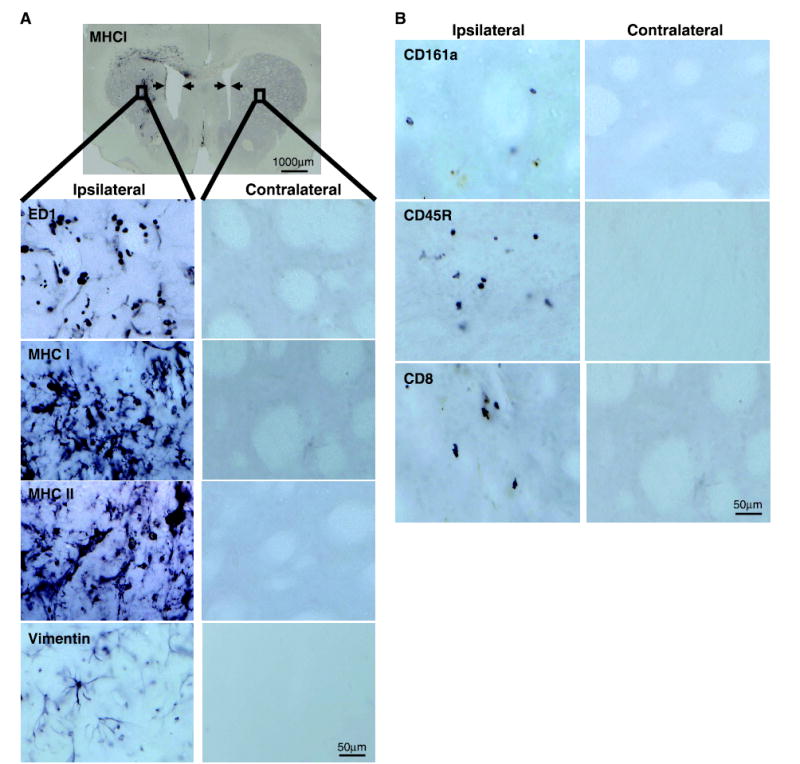
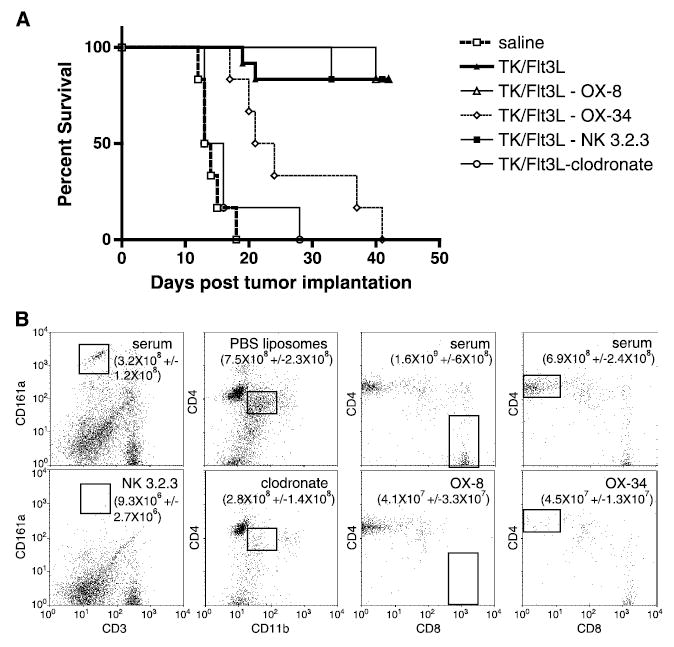
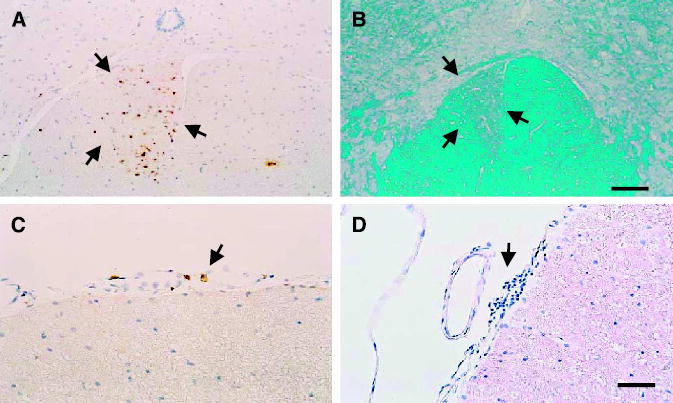
In spite of preclinical efficacy and recent randomized, controlled studies with adenoviral vectors expressing herpes simplex virus-1 thymidine kinase (HSV1-TK) showing statistically significant increases in survival, most clinical trials using single therapies have failed to provide major therapeutic breakthroughs. Because glioma is a disease with dismal prognosis and rapid progression, it is an attractive target for gene therapy. Preclinical models using microscopic brain tumor models (e.g., < or =0.3 mm3) may not reflect the pathophysiology and progression of large human tumors. To overcome some of these limitations, we developed a syngeneic large brain tumor model. In this model, administration of single therapeutic modalities, either conditional cytotoxicity or immunostimulation, fail. However, when various immunostimulatory therapies were delivered in combination with conditional cytotoxicity (HSV1-TK), only the combined delivery of fms-like tyrosine kinase ligand (Flt3L) and HSV1-TK significantly prolonged the survival of large tumor-bearing animals (> or =80%; P < or = 0.005). When either macrophages or CD4+ cells were depleted before administration of viral therapy, TK + Flt3L therapy failed to prolong survival. Meanwhile, depletion of CD8+ cells or natural killer cells did not affect TK + Flt3L efficacy. Spinal cord of animals surviving 6 months after TK + Flt3L were evaluated for the presence of autoimmune lesions. Whereas macrophages were present within the corticospinal tract and low levels of T-cell infiltration were detected, these effects are not indicative of an overt autoimmune disorder. We propose that combined Flt3L and HSV1-TK adenoviral-mediated gene therapy may provide an effective antiglioma treatment with increased efficacy in clinical trials of glioma.


Figures

Figure 1
Figure 1
Generation and functional characterization of RAdFlt3L. A, a schematic diagram depicting the organization of the adenovirus type 5 genome (Ad5). Expression cassettes with Escherichia coliLacZ gene (β-Gal), HSV1-TK cDNA, or human soluble Flt3L cDNA (Flt3L) under the control of the hCMV promoter were created. These expression vectors were subsequently inserted into the E1 region of the adenovirus genome as shown, generating the recombinant adenoviral vectors RAdβgal, RAdTK, and RAdFlt3L. B, Western blot to detect RAd-generated protein from of CNS-1 cells supernatants and lysates that were mock infected, infected with RAdβgal, RAdTK, RAdFlt3L, or RAdTK + RAdFlt3L. C, β-galactosidase enzymatic activity assay from cell lysates and supernatants infected with viruses described in (B). Only intracellular protein extracts from RAdβgal-infected CNS-1 cells displayed significant β-galactosidase activity when compared with control samples (27.25 μg o-nitrophenol/μg protein/min). No secreted β-galactosidase activity was evident in any samples. D, ELISA to detect intracellular and secreted Flt3L expressed from cells infected with the viruses described in (B). Intracellular human Flt3L expression was only observed in RAdFlt3L (641.5 pg/mg total protein) and RAdTK + RAdFlt3L (320.8 pg/mg total protein)–infected CNS-1 cells. In addition, secreted human Flt3L was only detected in the media of RAdFlt3L and RAdTK + RAdFlt3L–infected CNS-1 cells at concentrations of 2,640.5 and 2,537.8 pg/mL, respectively.
Figure 2
Figure 2
Single therapy with RAdTK improves survival in rats with microscopic brain tumors but is ineffective against large brain tumors. A, progressively increasing tumor sizes and volumes at 3 (A1), 6 (A2), and 10 (A3) days postimplantation of 5,000 CNS-1 cells into the brains of syngeneic Lewis rats. Tumor infiltration into the striatum was visualized using ED1, a marker of activated macrophages and microglial cells. Tumor volume was calculated to be 140 times greater at day 10 than at day 3. B, assessment of the survival efficiency of 8 × 10⁷ plaque-forming units of either RAdTK (followed by 7 days of systemic GCV treatment) in rats bearing tumors of different sizes. Treatments were delivered to growing CNS-1 tumors either at 3 (B1), 6 (B2), or 10 (B3) days following tumor implantation (black arrow at the top of each of the graphs). Controls animals were injected with saline or RAdβgal. Notice the drop in effectiveness of RAdTK as it is injected into progressively larger tumors. Bar, for (A1) to (A3), shown in (A3), 150 μm.
Figure 3
Figure 3
Combined treatment with RAdTK and RAdFlt3L significantly enhances survival in a large brain tumor model and cyclosporine A eliminates the efficiency of combined treatment. A, rats with large tumors were treated 10 days after CNS-1 cell implantation with either saline (□), or 1 × 10⁷ i.u. RAd0 (|), RAdTK (▵), RAdFlt3L (▾), or RAd TK/Flt3L (*). Whereas neither saline, RAd0, or RadFlt3L alter survival with all animals dying ~25 days after tumor implantation, RAd TK prolonged survival in 20% of animals. RAdTK + Flt3L prolonged survival in 70% of animals. B, rats with large tumors were treated 10 days after CNS-1 cell implantation with either saline (□) or 1 × 10⁷ i.u. RAd0 (|), RAdTK (▵), RAdCD40L (×), or RAd TK/RAdCD40L (•). Treatment with RAdTK resulted in 20% survival, whereas combined treatment with RAdCD40L resulted in 40% survival. C, rats with large tumors were treated 10 days after CNS-1 cell implantation with either saline (□) or 1 × 10⁷ i.u. RAd0 (|), RAdTK (▵), RAdIL-12 (▪), or RAd TK + RAdIL-12 (♦). Treatment with either RAdTK or RAdTK + RAdIL-12 resulted in 20% survival. Statistical analysis for (A) to (C) was done as indicated in Materials and Methods. Survival of animals treated with RAdTK + RAdFlt3L was statistically significantly increased compared with animals treated with either RAdTK or RAdTK + RAdIL-12 (**, P < 0.005); although the survival of animals treated with RAdTK + RAdCD40L seemed increased compared with animals treated with either RAdTK or RAdTK + RAdIL-12, this difference was not statistically significant. No statistically significant differences were found between RAdTK and RAdTK/RAdIL-12, or between RAd0, RAdFlt3L, RAdIL-12, or RAdCD40L treatments. D, survival of animals treated with the immunosuppressant cyclosporine A (solid lines are without cyclosporine A and dashed lines are with cyclosporine A in each treatment condition). Animals were immunosuppressed with cyclosporine A beginning day 7 after tumor implantation and continuing daily throughout the experiment. Animals treated with RAdTK + Flt3L displayed increased survival only when not treated with cyclosporine A. Treatment of animals injected in the brain with RAdTK + Flt3L with cyclosporine A reduced the efficiency of the combined treatment to that of RAdTK alone. Treatment of animals with RAdTK and cyclosporine A reduced the efficiency of RAdTK further, potentially suggesting that the effectiveness of RAdTK is due to immunostimulation. Animals treated with RAdhsFlt3L, with or without cyclosporine A, had no effect on animal survival. Statistical analysis was done as described in Materials and Methods. Animals treated with RAdTK + Flt3L − cyclosporine A showed statistically significant increased survival compared with those injected with RAdTK + RAdFlt3L + cyclosporine A, or those treated only with RAdTK, indicated by arrows (**, P < 0.005). None of the other survival curves were statistically significantly different.
Figure 4
Figure 4
Inflammatory responses observed in the CNS of rats in which RAdTK + RAdFlt3L resulted in tumor regression. Male Lewis rats bearing large tumors were injected with RAdTK+RAdFlt3L. Animals still surviving at 2 months were sacrificed and brain sections were stained. A, whereas no residual tumor was observed, animals show enlarged ventricles (indicated by arrows in MHC I staining of full brain) and immune marker up-regulation. Ipsilateral and contralateral sections of striatum are shown. Evidence of immune cell infiltration at and around the injection site is observed in increased levels of ED1-, MHC I–, MHC II–, and vimentin-positive cells. B, CD161a-, CD45R-, and CD8-positive cells were observed near the injection site at low levels. Low-magnification images were taken at ×1; bar, 1,000 μm. Higher-magnification images were taken at ×40 near the injection site as indicated by a black box in the low-magnification field; bars, 50 μm.
Figure 5
Figure 5
Depletion of specific subsets of immune cell alters therapeutic efficacy of RAdTK + Flt3L in macrophage and CD4+ cell–depleted animals. A, all animals were injected with 5,000 CNS-1 glioma cells. Nine days later, specific subsets of immune cells were depleted by i.p. injection of 1 mg OX-8, OX-34 or normal mouse serum, 0.5 mg of NK3.2.3, or 2 mL clodronate or PBS-filled liposomes (n = 6). Twenty-four hours following immune cell depletion, saline or RAdTK + Flt3L was intratumorally injected. A, Kaplan-Meier survival curve of all depleted animals (serum and PBS liposome, ▴; OX-8, ▵; OX-34, ⋄; NK3.2.3, ▪; and clodronate, ○) and control groups (saline treated, □). B, depletion efficiency and specificity was evaluated by flow cytometry in splenocytes from immune cell depleted or control animals seven days after depletion (n = 4). All samples were gated on lymphocyte populations by FSC and SSC. NK cells were identified as CD3, CD161a+. Macrophages were identified after gating CD45+ lymphocytes as CD4+, CD11b intermediate populations. CD4 cells were identified as CD4+, CD8, and CD8 cells were identified as CD4, CD8+ after gating respective populations for CD3+ lymphocytes. Numbers represent total number of a given cell population per spleen ± SE (n = 4).
Figure 6
Figure 6
Spinal cord neuropathology of animals surviving a large brain tumor for 6 months. Representative animals are illustrated herein. A and C, animals treated with RAdTK + RAdFlt3L and that survived tumor treatment for 6 months; A, distribution of macrophages (stained with ED1) in the corticospinal tract (outlined by black arrows), compatible with forebrain lesions to the pyramidal tract as caused by the growing tumor, and (C) indicates the distribution of T cells in the meninges of the same group of animals. Although the values of T cells in the meninges of these animals is extremely low, it is nevertheless higher than in animals not receiving any treatment. B, spinal cord of an animal treated with RAdTK and RAdCD40L stained with the Kluwer histochemical stain for myelin. Notice the unilateral area of demyelination in the spinal cord (outlined by black arrows), compatible with a lesion to the descending spinocortical tract, most possibly due to forebrain lesions to the pyramidal tract. D, largest infiltration of the meninges with T cells of any of the examined animals, and that was seen in an animal treated with RAdFlt3L and RAdIL12 (this animal displayed the largest tumor growth and brain inflammation at the time of sacrifice; data not shown). Bar, for all panels, shown in (D), 80 μm.

References

    1. Counsell CE, Grant R. Incidence studies of primary and secondary intracranial tumors: a systematic review of their methodology and results. J Neurooncol. 1998;37:241–50. - PubMed
    1. Pobereskin LH, Chadduck JB. Incidence of brain tumours in two English counties: a population based study. J Neurol Neurosurg Psychiatry. 2000;69:464–71. - PMC - PubMed
    1. Castro MG, Cowen R, Williamson IK, et al. Current and future strategies for the treatment of malignant brain tumors. Pharmacol Ther. 2003;98:71–108. - PubMed
    1. Dewey RA, Morrissey G, Cowsill CM, et al. Chronic brain inflammation and persistent herpes simplex virus 1 thymidine kinase expression in survivors of syngeneic glioma treated by adenovirus-mediated gene therapy: implications for clinical trials. Nat Med. 1999;5:1256–63. - PubMed
    1. Ali S, Curtin JF, Zirger JM, et al. Inflammatory and anti-glioma effects of an adenovirus expressing human soluble Fms-like tyrosine kinase 3 ligand (hsFlt3L): treatment with hsFlt3L inhibits intracranial glioma progression. Mol Ther. 2004;10:1071–84. - PMC - PubMed

Publication types

MeSH terms