. 2005 Sep;79(17):11476-86.
doi: 10.1128/JVI.79.17.11476-11486.2005.

The severe acute respiratory syndrome coronavirus nucleocapsid protein is phosphorylated and localizes in the cytoplasm by 14-3-3-mediated translocation

Affiliations

The severe acute respiratory syndrome coronavirus nucleocapsid protein is phosphorylated and localizes in the cytoplasm by 14-3-3-mediated translocation

Milan Surjit et al. J Virol. 2005 Sep.

Abstract

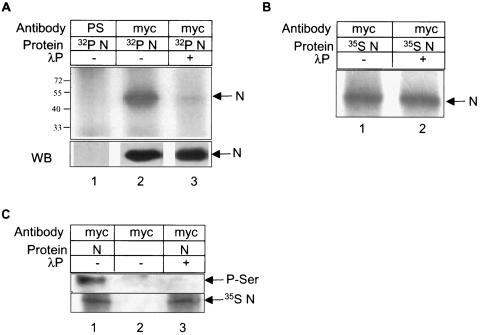
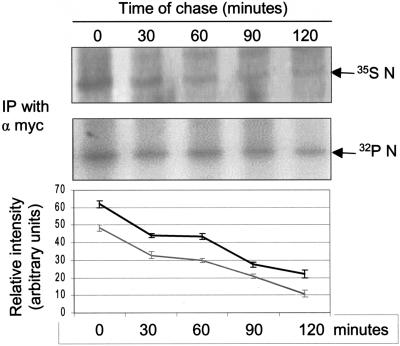
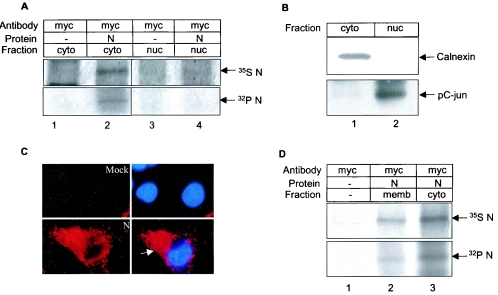
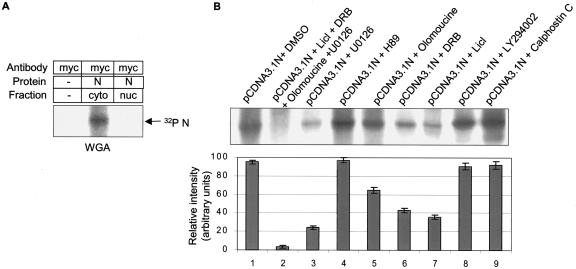
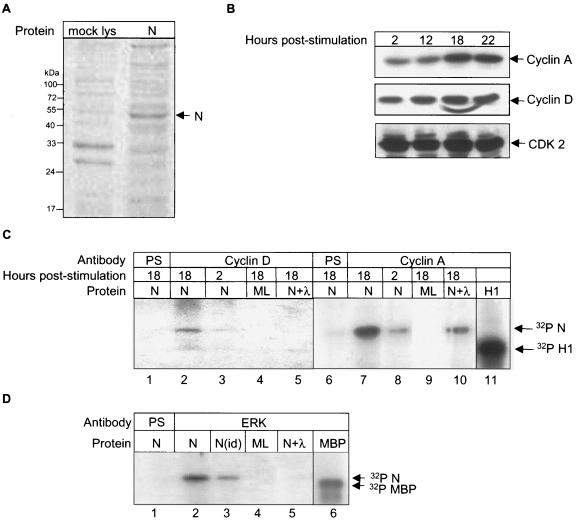
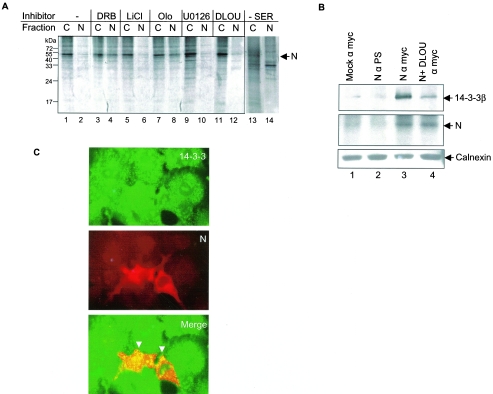
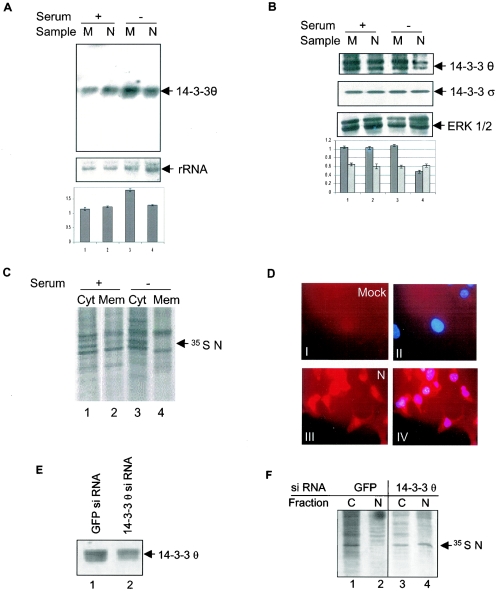
The severe acute respiratory syndrome coronavirus(SARS-CoV) nucleocapsid (N) protein is one of the four structural proteins of the virus and is predicted to be a 46-kDa phosphoprotein. Our in silico analysis predicted N to be heavily phosphorylated at multiple residues. Experimentally, we have shown in this report that the N protein of the SARS-CoV gets serine-phosphorylated by multiple kinases, in both the cytoplasm and the nucleus. The phosphoprotein is stable and localizes in the cytoplasm and coprecipitates with the membrane fraction. Also, using specific inhibitors of phosphorylation and an in vitro phosphorylation assay, we show that the nucleocapsid protein is a substrate of cyclin-dependent kinase (CDK), glycogen synthase kinase, mitogen-activated protein kinase, and casein kinase II. Further, we show that the phosphorylated protein is translocated to the cytoplasm by binding to 14-3-3 (tyrosine 3-monooxygenase/tryptophan 5-monooxygenase activation protein). 14-3-3 proteins are a family of highly conserved, ubiquitously expressed eukaryotic proteins that function primarily as adapters that modulate interactions between components of various cellular signaling and cell cycle regulatory pathways through phosphorylation-dependent protein-protein interactions. Coincidentally, the N protein was also found to downregulate the expression of the theta isoform of 14-3-3 (14-3-3theta), leading to the accumulation of phosphorylated N protein in the nucleus, in the absence of growth factors. Using short interfering RNA specific to 14-3-3theta we have inhibited its expression to show accumulation of phosphorylated N protein in the nucleus. Thus, the data presented here provide a possible mechanism for phosphorylation-dependent nucleocytoplasmic shuttling of the N protein. This 14-3-3-mediated transport of the phosphorylated N protein and its possible implications in interfering with the cellular machinery are discussed.


Figures

FIG. 1.
FIG. 1.
N protein is phosphorylated. (A) pCDNA3.1 N Myc-transfected and [32P]orthophosphate-labeled cell lysates were immunoprecipitated with preimmune serum (lane 1) or with anti-Myc antibody (lanes 2 and 3). Equal amounts of immunoprecipitated samples were treated with 400 units of λ phosphatase (lane 3). Samples were resolved in 12% SDS-PAGE and bands were detected by autoradiography. In the lower panel, 25% of each lysate was immunoprecipitated and Western blotted with anti-Myc antibody and the signal was detected by the enhanced chemiluminescence method. (B) pCDNA3.1 N Myc-transfected and 35S Promix-labeled cell lysates were untreated (lane 1) or treated with 400 units of λ phosphatase (lane2) and immunoprecipitated using anti-Myc antibody. Bands were detected by autoradiography. (C) pCDNA3.1 (lane 2) or pCDNA3.1 N (lanes 1 and 3)-transfected and 35S Promix-labeled cells were immunoprecipitated with anti-Myc antibody and Western blotted with phosphoserine antibody. Equal amounts of immunoprecipitated lysates were treated with 400 units of λ phosphatase (lane 3). The same blot was air dried and exposed to X-ray film overnight to check the level of N expression (lower panel).
FIG. 2.
FIG. 2.
Pulse-chase analysis of N protein. pCDNA3.1 N-transfected cells were labeled with 35S Promix (upper panel) or [32P]orthophosphate (lower panel), chased in complete medium for the indicated time periods, and the N protein was immunoprecipitated using anti-Myc antibody. Protein bands were detected by autoradiography. The figure shows a representative gel from one of three sets of experiments. The graph shows the average ± standard deviation of three independent sets of experiments. The gray line represents the total N protein. The black line represents phosphorylated N protein. The x axis represents time and the y axis represents relative band intensity at different time points.
FIG. 3.
FIG. 3.
Subcellular localization of N protein. (A) pCDNA 3.1 (lane 1 and 3) or pCDNA3.1 N (lane 2 and 4)-transfected cells labeled with [32P]orthophosphate (lower panel) or 35S Promix (upper panel) were fractionated and immunoprecipitated using anti-Myc antibody. Lanes 1 and 2: cytoplasmic fraction; lanes 3 and 4: nuclear fraction. (B) Cytoplasmic (lane 1) and nuclear (lane 2) fractions from control cell lysates were Western blotted with anti-calnexin (upper panel) and phospho-c-Jun (lower panel) antibody. (C) Mock (upper panel) or pCDNA 3.1 N (lower panel)-transfected cells were probed with anti-Myc antibody followed by Texas red and DAPI staining and the corresponding fluorescence was visualized using an immunofluorescence microscope. The left panel shows image of N expression and right panel shows a merged image of nuclear staining (DAPI) over the Texas red stain in the same field. The arrow shows cytoplasmic localization of the N protein. (D) pCDNA 3.1 (lane 1) or pCDNA 3.1 N (lanes 2 and 3)-transfected cells were labeled with 35S Promix (upper panel) or [32P]orthophosphate (lower panel). The membrane (lane2) and cytoplasmic (lane 3) fractions were immunoprecipitated with anti-Myc antibody. Radiolabeled proteins were detected by autoradiography.
FIG. 4.
FIG. 4.
Effect of different inhibitors on N phosphorylation. (A) pCDNA3.1 N-transfected cells were treated with wheat germ agglutinin (20 μg/ml) during the starvation and labeling period. Cytoplasmic (lane 2) and nuclear (lane 3) fractions were immunoprecipitated using anti-Myc antibody, resolved by 12% SDS-PAGE, and the protein bands were detected by fluorography. Lane 1 represents pCDNA3.1-transfected cells treated with wheat germ agglutinin (WGA) whole-cell extract processed simultaneously. (B) pCDNA3.1 N-transfected cells were treated with different inhibitors, labeled with [32P]orthophosphate, and the samples were subsequently immunoprecipitated using anti-Myc antibody. The upper panel shows a representative gel. The band intensities were quantified from three independent sets of experiments and the average relative intensity ± standard deviation was calculated as shown in the bar graph.
FIG. 5.
FIG. 5.
In vitro phosphorylation of the N protein by cyclin-CDK complex and mitogen-activated protein kinase. (A) Coomassie brilliant blue-stained gel showing expression of the N protein (lane 2) in an in vitro translation reaction. Lane 1 represents mock-translated lysate. (B) COS-1 cells were starved for 34 h in serum-free medium, stimulated with complete medium for the indicated times, and equal amounts of the lysates were Western blotted using cyclin A (upper panel), cyclin D (middle panel), and CDK2 (lower panel) antibodies. Bands were detected by the enhanced chemiluminescence method. (C) COS-1 cells were starved for 34 h in serum-free medium, stimulated with complete medium for the indicated periods, and immunoprecipitated using the respective antibodies followed by incubation with in vitro-expressed N protein (lanes 1, 2, 3, 5, 6, 7, 8, and 10) or mock-expressed lysate (ML; lanes 4 and 9). Lanes 1 and 6 were immunoprecipitated using preimmune serum (PS). Bands corresponding to in vitro-phosphorylated N were observed by autoradiography. Lanes 5 and 10 represents N protein treated with λ phosphatase. Lane 11 shows phosphorylated histone H1. Lane 11 is a gel exposed for a shorter period. (D) In vitro phosphorylation of N protein by ERK1/2. COS-1 cells were immunoprecipitated using preimmune serum (lane 1) or ERK1/2 antibody (lanes 2 to 5). Lane 3 represents ERK1/2 immunodepleted sample. Lanes 4 and 5 represent mock lysate (ML) and λ phosphatase-treated samples, respectively. Lane 6 shows the phosphorylated maltose-binding protein band. Lane 6 was exposed for a shorter period.
FIG. 6.
FIG. 6.
Phosphorylation-dependent 14-3-3 binding translocates N protein to the cytoplasm. (A) COS-1 cells transfected with pCDNA3.1 N were treated with carrier only or with inhibitors or cells were serum starved for 24 h (lanes 13 and 14); labeled with 35S Promix, and cytoplasmic(C) and nuclear (N) fractions were immunoprecipitated using anti-Myc antibody, resolved by 12% SDS-PAGE, and bands were detected by fluorography. O, olomoucine; U, U0126; D, DRB; L, LiCl. (B) pCDNA 3.1 (mock; lane1) or pCDNA 3.1 N (lane 2, 3 and 4)-transfected cells labeled with 35S Promix were immunoprecipitated using the indicated antibodies (i.e., preimmune serum for lane 2 and anti-Myc antibody for lanes 3 and 4), resolved on 12% SDS-PAGE, and Western blotted using anti-14-3-3 antibody (upper panel). The same blot was air-dried and exposed to X-ray film to check the expression of N protein (middle panel) by autoradiography. A 20% aliquot of the lysate was loaded on SDS-PAGE gels, Western blotted, transferred, and probed using anticalnexin antibody (lower panel). D, DRB inhibitor was added to the lane 4 sample as described in Materials and Methods. PS, preimmune serum. (C) pCDNA3.1 N-transfected cells were stained with fluorescein isothiocyanate-labeled anti-rabbit (14-3-3 staining, upper panel) and Texas red-labeled anti-mouse (Myc-tagged N, middle panel) antibodies and fluorescence was visualized by using an immunofluorescence microscope. The lower panel shows a merged image of the upper and middle panels done by using the Adobe Photoshop 6.0 program. The arrows show colocalization between N and 14-3-3 protein.
FIG. 7.
FIG. 7.
N protein down-regulates 14-3-3θ expression and localizes to the nucleus in the absence of growth factors. (A) pCDNA 3.1 (lane 1 and 3) or pCDNA 3.1 N (lane 2 and 4)-transfected cells were maintained for 24 h in the indicated medium 24 h posttransfection and RNA was isolated; 15 μg of total RNA of each sample was used for Northern blotting. The upper panel shows the level of 14-3-3θ. The same blot was probed for the level of rRNA to check equal loading in each lane (lower panel). Quantification was done using NIH Image Program and band intensity was normalized with reference to rRNA, relative fold intensity was calculated and the graph was plotted. Data represent the mean of three independent experiments. (B) pCDNA 3.1 (lane 1 and 3) or pCDNA 3.1 N (lane 2 and 4)-transfected cells were maintained for 24 h in the indicated medium 24 h posttransfection and aliquots of total cell lysates were Western blotted with 14-3-3θ (first panel) or 14-3-3σ antibody (second panel). The sameblot was stripped and probed with total ERK antibody to check for equal loading (3rd panel). The data shown are representative of three independent sets of experiments. Band intensities were quantified using NIH Image Program and values were normalized with reference to that of loading control, fold difference was calculated and average ± standard deviation were plotted in the graph (fourth panel). The dark bar and light bar in the graph represent 14-3-3θ and 14-3-3σ, respectively. (C) At 24 h posttransfection, pCDNA 3.1 N-expressing cells were maintained for further 24 h in the indicated medium, labeled with 35S Promix, cytoplasmic (cyt) and membrane (mem) fractions were immunoprecipitated using anti-Myc antibody, resolved by 12% SDS-PAGE, and bands were detected by fluorography. (D) At 24 h posttransfection, mock pCDNA 3.1 (upper panel) or pCDNA 3.1 N (lower panel)-expressing cells were maintained for a further 24 h in the absence of growth factors, stained with Texas red (N staining, left panel) and DAPI (nucleus staining) and images were visualized in an immunofluorescence microscope. Image III shows nuclear and cytoplasmic staining of N-expressing cells. Right panel IV shows DAPI-stained nucleus superimposed over Texas red-stained N to show colocalization. (E) COS-1 cells were transfected with GFP siRNA (lane 1) or 14-3-3θ siRNA (lane 2) expression plasmid and 48 h posttransfection total cell lysate was immunoprecipitated and immunoblotted with anti-14-3-3θ antibody. (F) COS-1 cells cotransfected with pCDNA3.1 N and GFP (lane 1 and 2) or 14-3-3θ (lane 3 and 4) siRNA expression plasmids were separated into nuclear (N) and cytoplasmic (C) fractions 48 h posttransfection, immunoprecipitated using anti-Myc antibody, the proteins were resolved by 10% SDS-PAGE, and the bands were visualized by fluorography.

References

    1. Buttner, J. 1977. Evaluation of the diagnostic value of laboratory investigations. J. Clin. Chem. Clin. Biochem. 15:1-12. - PubMed
    1. Centers for Disease Control SARS Investigative Team and A. T. Fleischauer. 2003. Outbreak of severe acute respiratory syndrome -worldwide. Morb. Mortal. Wkly. Rep. 52:226-228. - PubMed
    1. Chijiwa, T., A. Mishima, M. Hagiwara, M. Sano, K. Hayashi, T. Inoue, K. Naito, T. Toshioka, and H. Hidaka. 1990. Inhibition of forskolin-induced neurite outgrowth and protein phosphorylation by a newly synthesized selective inhibitor of cyclic AMP-dependent protein kinase, N-[2-(p-bromocinnamylamino)ethyl]-5-isoquinolinesulfonamide (H-89), of PC12D pheochromocytoma cells. J. Biol. Chem. 265:5267-5272. - PubMed
    1. Connor, M. K., R. Kotchetkov, S. Cariou, A. Resch, R. Lupetti, R. G. Beniston, F. Melchior, L. Hengst, and J. M. Slingerland. 2003. CRM1/Ran-mediated nuclear export of p27(Kip1) involves a nuclear export signal and links p27 export and proteolysis. Mol. Biol. Cell 14:201-213. - PMC - PubMed
    1. Donnelly, C. A., A. C. Ghani, G. M. Leung, A. J. Hedley, C. Fraser, S. Riley, L. J. Abu-Raddad, L. M. Ho, T. Q. Thach, P. Chau, K. P. Chan, T. H. Lam, L. Y. Tse, T. Tsang, S. H. Liu, J. H. Kong, E. M. Lau, N. M. Ferguson, and R. M. Anderson. 2003. Epidemiological determinants of spread of causative agent of severe acute respiratory syndrome in Hong Kong. Lancet 361:1761-1766. - PMC - PubMed

Publication types

MeSH terms