. 2005 Aug 15;170(4):607-18.
doi: 10.1083/jcb.200505128.

An enzymatic cascade of Rab5 effectors regulates phosphoinositide turnover in the endocytic pathway

Affiliations

An enzymatic cascade of Rab5 effectors regulates phosphoinositide turnover in the endocytic pathway

Hye-Won Shin et al. J Cell Biol. .

Abstract

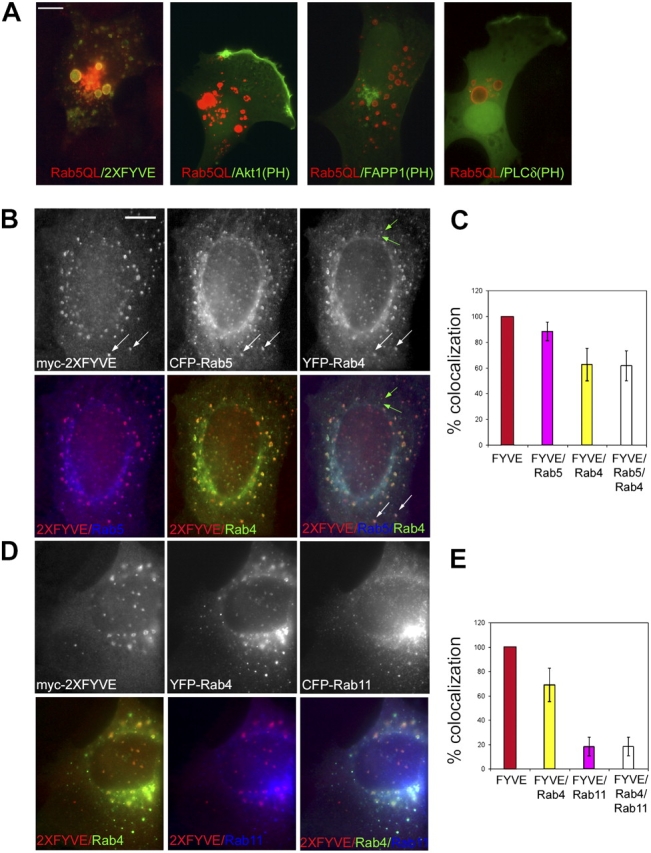
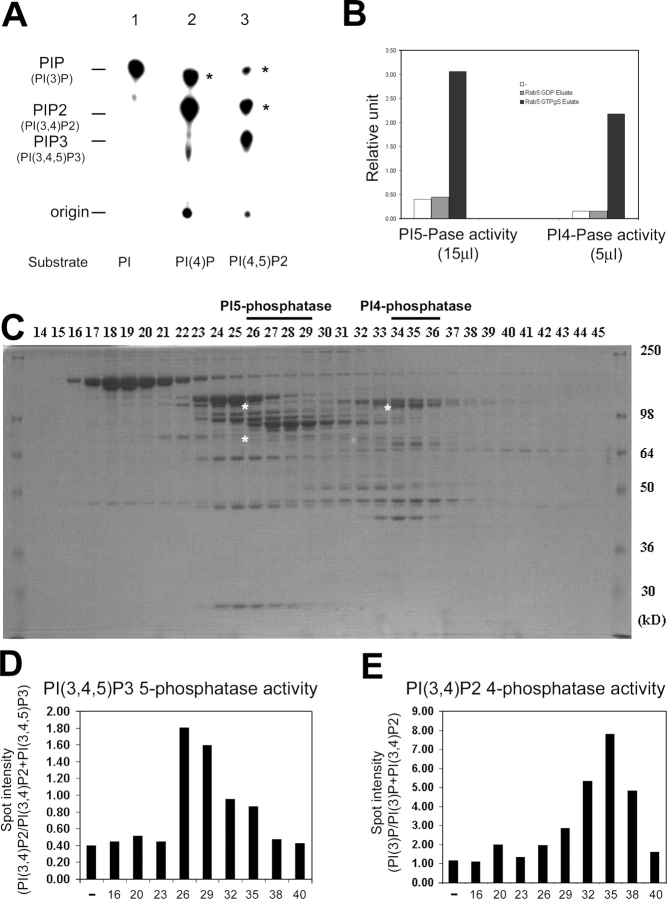
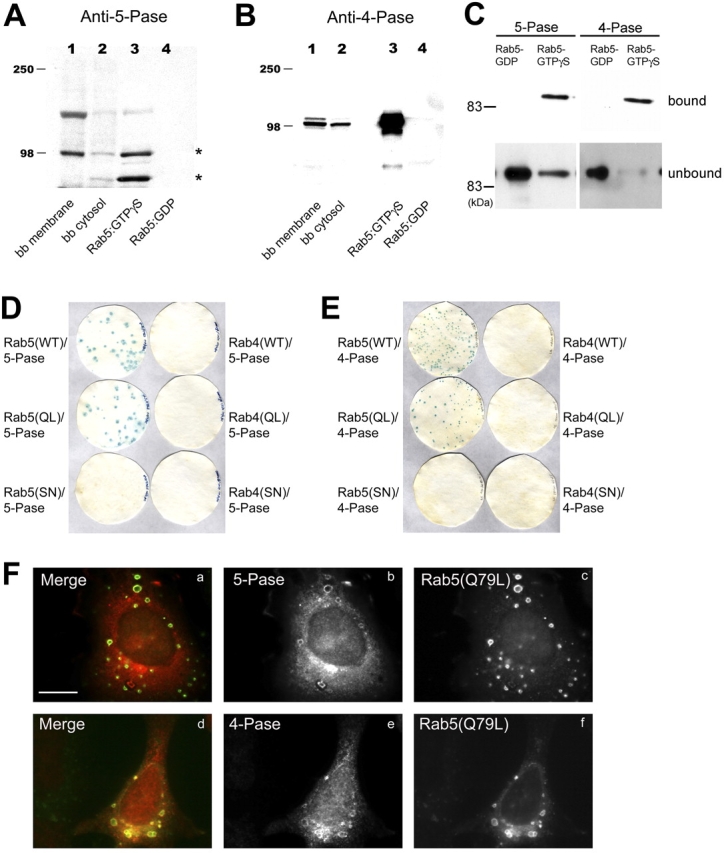
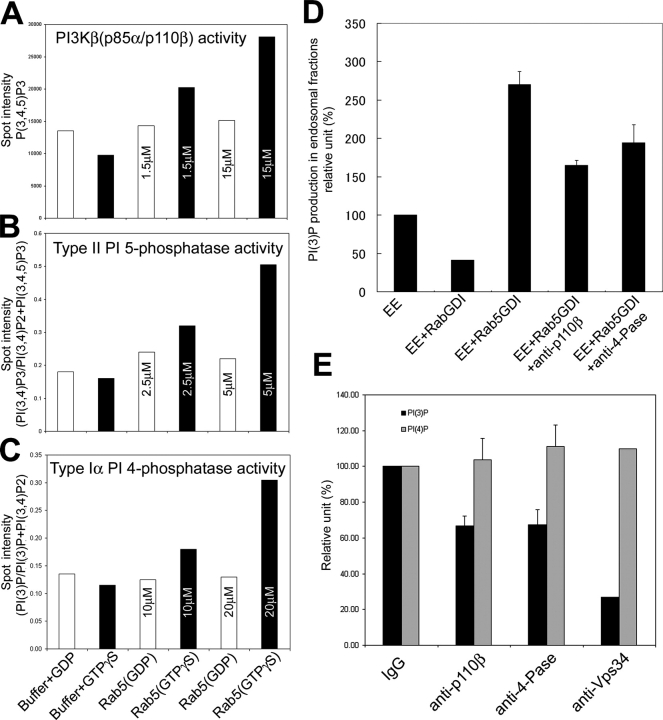
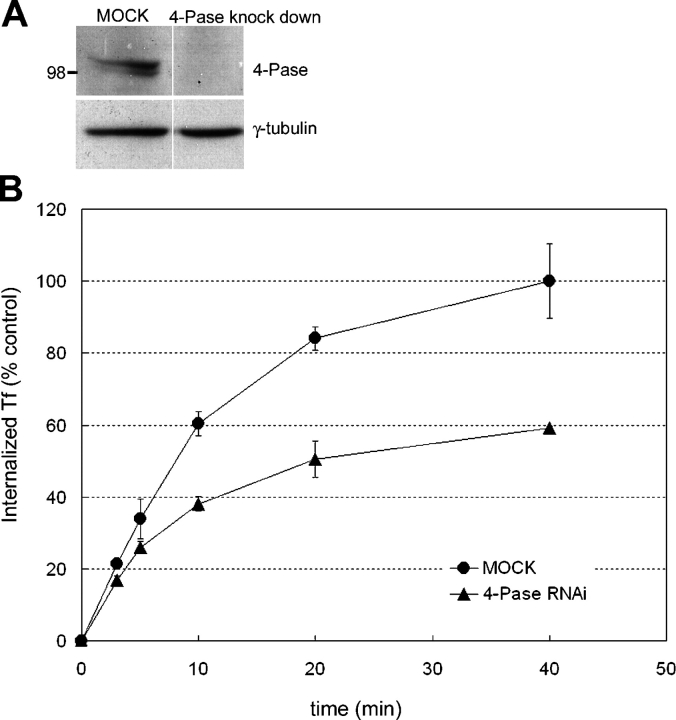
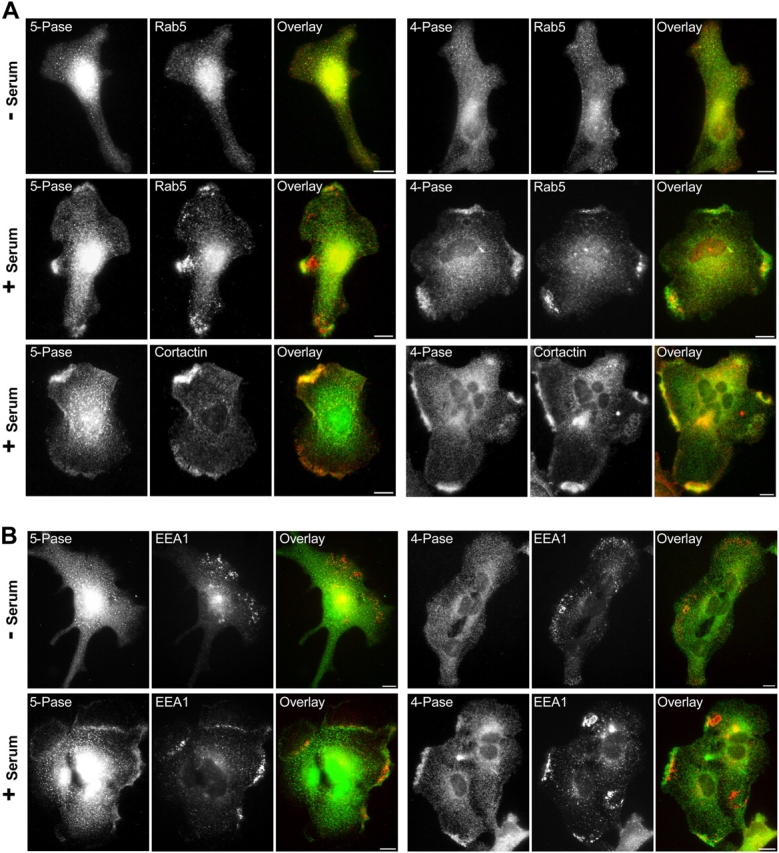
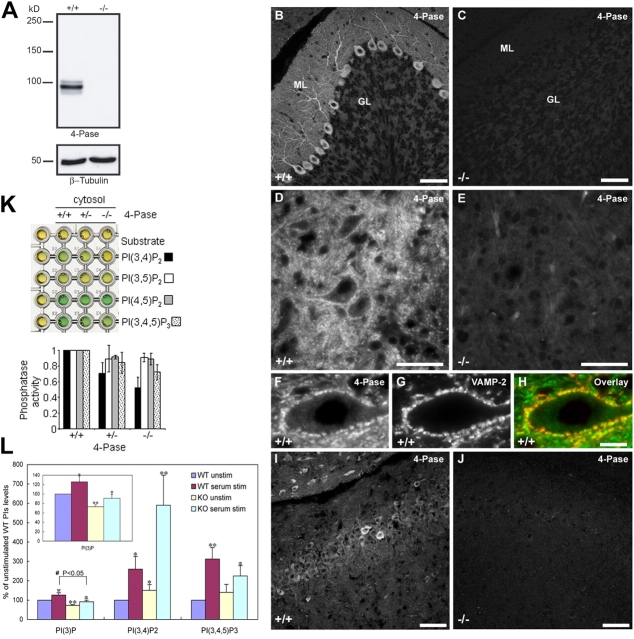
Generation and turnover of phosphoinositides (PIs) must be coordinated in a spatial- and temporal-restricted manner. The small GTPase Rab5 interacts with two PI 3-kinases, Vps34 and PI3Kbeta, suggesting that it regulates the production of 3-PIs at various stages of the early endocytic pathway. Here, we discovered that Rab5 also interacts directly with PI 5- and PI 4-phosphatases and stimulates their activity. Rab5 regulates the production of phosphatidylinositol 3-phosphate (PtdIns[3]P) through a dual mechanism, by directly phosphorylating phosphatidylinositol via Vps34 and by a hierarchical enzymatic cascade of phosphoinositide-3-kinasebeta (PI3Kbeta), PI 5-, and PI 4-phosphatases. The functional importance of such an enzymatic pathway is demonstrated by the inhibition of transferrin uptake upon silencing of PI 4-phosphatase and studies in weeble mutant mice, where deficiency of PI 4-phosphatase causes an increase of PtdIns(3,4)P2 and a reduction in PtdIns(3)P. Activation of PI 3-kinase at the plasma membrane is accompanied by the recruitment of Rab5, PI 4-, and PI 5-phosphatases to the cell cortex. Our data provide the first evidence for a dual role of a Rab GTPase in regulating both generation and turnover of PIs via PI kinases and phosphatases to coordinate signaling functions with organelle homeostasis.


Figures

Figure 1.
Figure 1.
PtdIns(3)P is enriched in the Rab5 domain. (A) NIH3T3 cells expressing Rab5(Q79L) and GFP-tagged 2XFYVE, Akt PH domain, FAPP1 PH domain, or PLCδ PH domain were stained with antibodies against Rab5 (4F11) followed by rhodamine-conjugated secondary antibodies. Bar, 10 μm. A431 cells were microinjected with myc-2XFYVE, CFP–Rab5, and YFP–Rab4 (B) or myc–2XFYVE, YFP–Rab4, and CFP–Rab11 (D) and stained with antibodies against myc (9E10) and Texas red–conjugated secondary antibodies. The extent of colocalization between 2XFYVE, Rab5, and Rab4 (C) or 2XFYVE, Rab4, and Rab11 (E) was quantified. Colors in the histogram correspond to those used in the merge of double or triple fluorescent signals in the panels. White arrows indicate positive for 2XFYVE, Rab5, and Rab4. Green arrows indicate positive for Rab4 but negative for 2XFYVE and Rab5. Bar, 2 μm.
Figure 2.
Figure 2.
PI phosphatases activity in Rab5–GTP column eluate. (A) PI3-K activity assay on eluates from GST–Rab5–GTPγS affinity columns was performed using PtdIns (PI), PtdIns(4)P (PI[4]P), or PtdIns(4,5)P2 (PI[4,5]P2) as substrates. Asterisks indicate extra product of 3′-phosphorylated PIs (see details in the Results section). (B) The PtdIns(3,4,5)P3 5-phosphatase or PtdIns(3,4)P2 4-phosphatase assay from eluates (15 or 5 μl, respectively) of GST–Rab5–GDP (gray bar) or GST–Rab5–GTPγS (black bar) affinity columns or buffer alone (white bar) was performed using 32P-labeled PtdIns(3,4,5)P3 or PtdIns(3,4)P2 as substrates (see Materials and methods; data are representative of two independent experiments). Higher amounts of Rab5 column eluate were required to measure the activity of PI 5-phosphatase compared with PI 4-phosphatase. (C) The eluate from GST–Rab5–GTPγS affinity column was separated using Superose 6 column and fractions analyzed by SDS-PAGE followed by Coomassie staining (asterisks indicate sequenced phosphatases). (D and E) Every third fraction was analyzed by either PtdIns(3,4,5)P3 5-phosphatase assay or PtdIns(3,4)P2 4-phosphatase assay. The phosphatase activity in peak fractions (fractions 25–29 and 34–36) was determined in two independent experiments.
Figure 3.
Figure 3.
Identification of the 5- and 4-Pases and their direct and specific interaction with Rab5 in vivo and in vitro. (A and B) Eluates from GST–Rab5–GDP and GST–Rab5–GTPγS affinity columns, bovine brain (bb) cytosol, and membrane fractions were analyzed by Western blotting using antibodies against 5- and 4-Pase. (C) Beads with GST–Rab5 preloaded with GDP or GTPγS were incubated with 5 μg recombinant 5- or 4-Pases bound proteins were eluted and, along with unbound material, analyzed by Western blotting using anti–5- or 4-Pase antibodies. (D and E) L40p cotransformants with LexA–Rab5 (WT), –Rab5Q79L (QL), –Rab5S34N (SN), –Rab4 (WT), –Rab4Q67L (QL), or –Rab4S22N (SN) and either pGAD10–5-Pase or –4-Pase were plated on WL dropout media and analyzed by β-galactosidase replica filter assay. (F) HA–5-Pase (a–c) or 4-Pase (d–f) was coexpressed with Rab5(Q79L) or myc–Rab5(Q79L), respectively, in HeLa cells with vaccinia virus expression system. Cells were fixed and stained with antibodies against Rab5 (4F11) and HA (3F10) and then with Alexa 488–conjugated anti–mouse and Texas red–conjugated anti–rat secondary antibodies (a–c) or with anti-myc (9E10) and 4-Pase antibodies and then with Alexa 488–conjugated anti–mouse and rhodamine-conjugated anti–rabbit secondary antibodies (d–f). Bar, 10 μm.
Figure 4.
Figure 4.
Rab5 regulates PI(3)P production with its effectors. (A–C) The activity of recombinant protein of PI3Kβ (p85α–p110β, 150 nM) or 5-Pase (25 nM) or 4-Pase fraction (1 μl fraction 36) were analyzed with recombinant Rab5–GDP or–GTPγS in the presence of GDP (white bar) or GTPγS (black bar), as indicated. The concentration of recombinant Rab5 is indicated in each bar. Bars indicate the stimulation of the enzymatic activity expressed in arbitrary units relative to control (see Materials and methods) and each set of data is representative from three independent experiments. Spot areas were quantified by BAS3000 and correspond to the following PIs: (A) refers to the spot area of PI(3,4,5)P3, (B) (PI[3,4]P2/[PI{3,4}P2+PI{3,4,5}P3]), (C) (PI[3]P/[PI{3}P+PI{3,4}P2]). (D) Endosomal fractions were incubated with buffer, 150 nM Rab5–GDI complex alone, 150 nM Rab5–GDI with anti-p110β or anti–4-Pase, or 5 μM HIS–RabGDI in the presence of 100 μM GTP or GDP and [32P]ATP for 5 min at 37°C. (E) Endosomal fractions were incubated with IgG, anti-p110β, anti–4-Pase or anti-hVps34 function blocking Abs and [32P]ATP for 5 min at 37°C. (D and E) Lipids were extracted, deacylated, and analyzed by HPLC (see Materials and methods). Data are means SD of two or three independent experiments.
Figure 5.
Figure 5.
Knockdown of 4-Pase decrease transferrin uptake. (A) Reduced levels of 4-Pase 72 h after transfection of HeLa cells with siRNA, as detected by Western blot. (B) Cells transfected with unspecific (diamonds) or 4-Pase–specific (triangles) siRNA were allowed to internalize biotinylated transferrin for the indicated times. The internalized transferrin was quantified as described in Materials and methods, and standardized with respect to total protein concentration of the lysate and expressed as percent of the amount of internalized transferrin in control cells at t = 40 min (n = 4; mean ± SD of two independent experiments).
Figure 6.
Figure 6.
Localization of 5- and 4-Pase in cultured astrocytes. Cultured astrocytes starved overnight in serum-free medium were stimulated with 10% FCS-containing medium for 15 min at 37°C, stained by immunofluorescence with rabbit polyclonal antibodies against 4- or 5-Pase (green), and counterstained (red) with mouse antibodies directed against Rab5 (4F11) and cortactin or human autoantibodies directed against EEA1. Bars, 10 μm.
Figure 7.
Figure 7.
Immunohistochemistry and PIs analysis in weeble mice. (A) Western blot for 4-Pase in +/+ and −/− mice and, as control, for β-tubulin. (B–J) Fluorescence microscopy analysis of 4-Pase on cerebellar and brain sections from 12-d-old wt (+/+; B, D, F, and I) and weeble (−/−; C, E, and J) mice. In +/+ mice, 4-Pase immunoreactivity was highly enriched in Purkinje cells and present throughout their cell bodies and dendrites (B) as well as axons and axon terminals in the deep cerebellar nuclei (D). (F) 4-Pase positive (green) Purkinje cell nerve terminals that outline the profile of a neuron in the deep cerebellar nuclei were counterstained with anti-VAMP2/synaptobrevins 2 antibodies (red). Green not overlapping with red signal represent nonsynaptic portions of Purkinje cell axons. (I) shows 4-Pase immunoreactivity in the hippocampus of +/+ mice. In −/− mice there was no immunoreactivity for 4-Pase in either the cerebellum (C and E), or the hippocampus (j). Bars: (A–I) 50 μm; (insets) 25 μm. ML, molecular layer; GL, granular layer; N, nucleus. (K) Production of free phosphate was measured with mice brain cytosol in the presence of the indicated substrates (see Materials and methods). The PI(3,4)P2 phosphatase activity is specifically impaired in the weeble mutant (−/−) mice. (L) Cultured astrocytes were labeled with [3H]myo-inositol and then incubated with FCS-free ([3H]myo-inositol containing) medium. After the cells were stimulated with 10% FCS for 15 min at 37°C, total lipids were extracted and analyzed by HPLC. Data show the percentages of fold increase compared with the unstimulated wt astrocytes and are means ± SD of three independent experiments. The symbols indicate the results of t test analysis; *, P < 0.05, **, P < 0.01 compared with the unstimulated wt astrocytes.

References

    1. Attree, O., I.M. Olivos, I. Okabe, L.C. Bailey, D.L. Nelson, R.A. Lewis, R.R. McInnes, and R.L. Nussbaum. 1992. The Lowe's oculocerebrorenal syndrome gene encodes a protein highly homologous to inositol polyphosphate-5-phosphatase. Nature. 358:239–242. - PubMed
    1. Backman, S.A., V. Stambolic, A. Suzuki, J. Haight, A. Elia, J. Pretorius, M.S. Tsao, P. Shannon, B. Bolon, G.O. Ivy, and T.W. Mak. 2001. Deletion of Pten in mouse brain causes seizures, ataxia and defects in soma size resembling Lhermitte-Duclos disease. Nat. Genet. 29:396–403. - PubMed
    1. Cantley, L.C., and B.G. Neel. 1999. New insights into tumor suppression: PTEN suppresses tumor formation by restraining the phosphoinositide 3-kinase/AKT pathway. Proc. Natl. Acad. Sci. USA. 96:4240–4245. - PMC - PubMed
    1. Choudhury, R., A. Diao, F. Zhang, E. Eisenberg, A. Saint-Pol, C. Williams, A. Konstantakopoulos, J. Lucocq, L. Johannes, C. Rabouille, et al. 2005. Lowe syndrome protein OCRL1 interacts with clathrin and regulates protein trafficking between endosomes and the trans-Golgi network. Mol. Biol. Cell. 10.1091/mbc.E05-02-0120. - DOI - PMC - PubMed
    1. Christoforidis, S., H. McBride, D. Burgoyne, and M. Zerial. 1999. a. The Rab5 effector EEA1 is a core component of endosome docking. Nature. 397:621–625. - PubMed

Publication types

MeSH terms

Substances