. 2005 Aug 15;170(4):619-26.
doi: 10.1083/jcb.200503140.

Reaching out for signals: filopodia sense EGF and respond by directed retrograde transport of activated receptors

Affiliations

Reaching out for signals: filopodia sense EGF and respond by directed retrograde transport of activated receptors

Diane S Lidke et al. J Cell Biol. .

Abstract

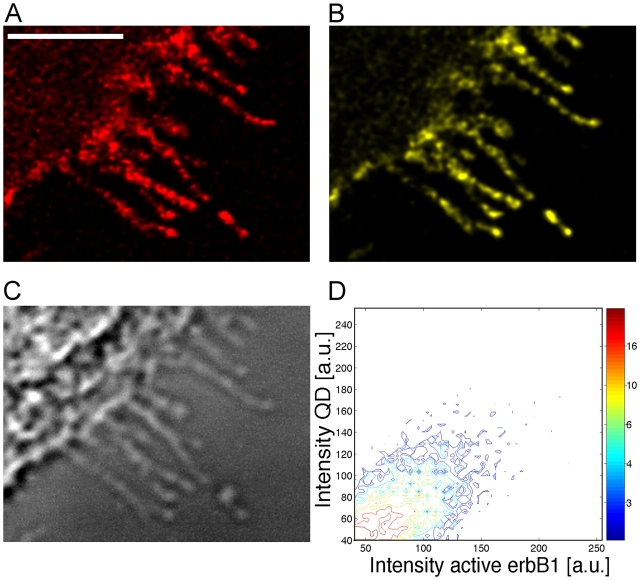
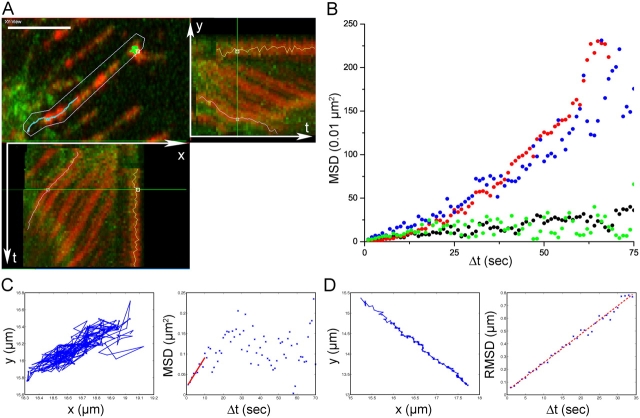
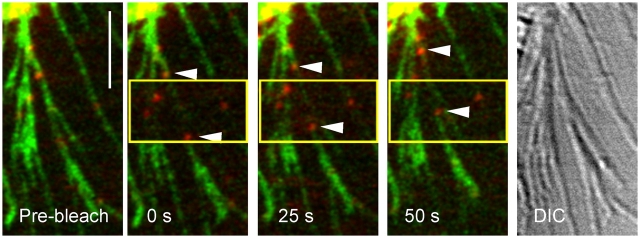
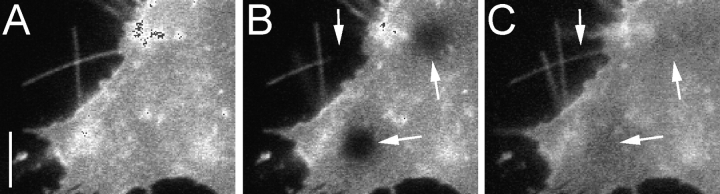
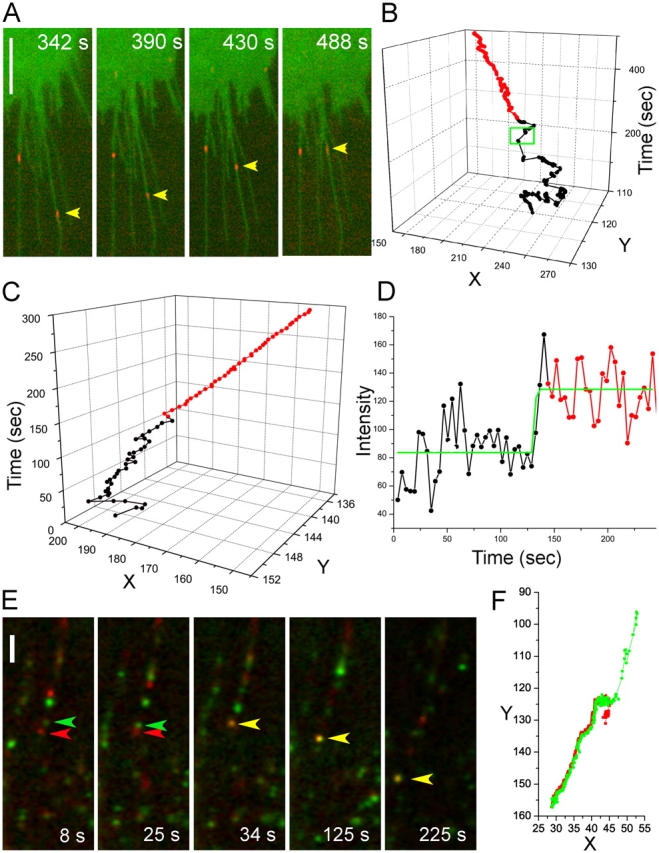
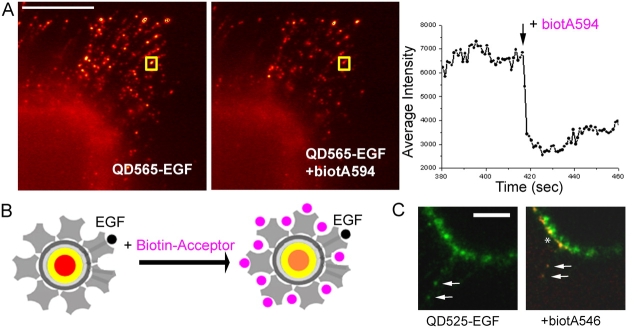
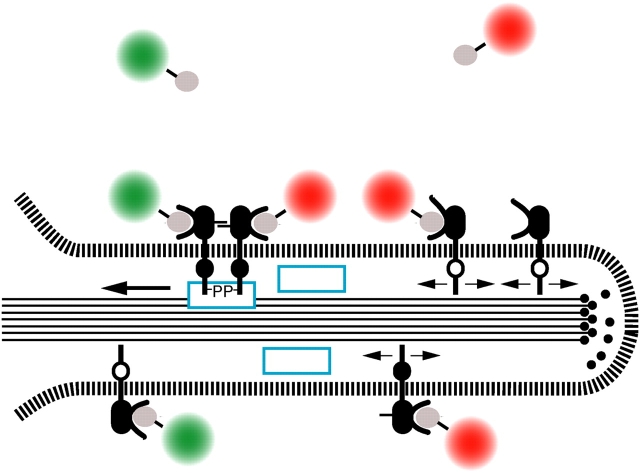
ErbB1 receptors situated on cellular filopodia undergo systematic retrograde transport after binding of the epidermal growth factor (EGF) and activation of the receptor tyrosine kinase. Specific inhibitors of the erbB1 receptor tyrosine kinase as well as cytochalasin D, a disruptor of the actin cytoskeleton, abolish transport but not free diffusion of the receptor-ligand complex. Diffusion constants and transport rates were determined with single molecule sensitivity by tracking receptors labeled with EGF conjugated to fluorescent quantum dots. Retrograde transport precedes receptor endocytosis, which occurs at the base of the filopodia. Initiation of transport requires the interaction and concerted activation of at least two liganded receptors and proceeds at a constant rate mediated by association with actin. These findings suggest a mechanism by which filopodia detect the presence and concentration of effector molecules far from the cell body and mediate cellular responses via directed transport of activated receptors.


Figures

Figure 1.
Figure 1.
Activation of erbB1 by binding of EGF-QD. A431 cells expressing endogenous erbB1 after incubation with 1 nM EGF-QD for 15 min at 4°C followed by 5 min at 37°C were fixed in 4% PFA and immunostained with anti-activated erbB1 and Cy5 GAMIG. (A) QD signal. (B) Activated erbB1. (C) DIC image. (D) Two-dimensional histogram showing the correlation between QD signal and antibody signal. Stacks of three confocal images at each wavelength were deconvolved. Bar, 5 μm.
Figure 2.
Figure 2.
Quantitative evaluation of receptor diffusion and retrograde transport. (A) Retrograde transport of EGF-QD–erbB1s on filopodia of living A431 cells expressing endogenous erbB1 and erbB1-eGFP. (top left) Magnified region of the cell periphery showing filopodia (green) with bound EGF-QDs (red). Kymograph of the EGF-QD fluorescence signals on the selected filopodium showing x versus time (bottom left) and y versus time (top right). The QD loci move down the filopodia toward the cell body (located in the bottom left corner of the image), resulting in a net movement left in x and down in y. Loci that do not transport remain in the same place over time and show a vertical (x) and horizontal (y) line in the projections. The turquoise line traces one locus that transported and the green line one that did not. Bar, 5 μm. See also Video 1, available at http://www.jcb.org/cgi/content/full/jcb.200503140/DC1. (B) Typical MSD plots of EGF-QD–erbB1 complexes under different conditions: untreated (blue), nocodazole (red), cytochalasin D (green), and PD153035 (black). (C) Typical trajectory (left) and MSD plot (right) for an EGF-QD–erbB1 loci undergoing diffusion on a cell treated with PD153035. The first 10 points of the MSD plot were fit to MSD = 2DΔt (red line). (D) Typical trajectory (left) and RMSD plot (right) for an EGF-QD–erbB1 loci undergoing directed transport on an untreated cell. The RMSD plots were fit to RMSD = vΔt (red line).
Figure 3.
Figure 3.
Simultaneous tracking of GFP-actin and EGF-QD–erbB1. Selected frames from time series of EGF-QD–erbB1 (red) undergoing transport on the filopodia of HeLa cells expressing GFP-actin (green). After bleaching of GFP-actin (in yellow box), the QDs (arrowheads) are transported to the cell body (top left corner) at the same rate as the unbleached GFP-actin. (right) DIC image of filopodia. Images are single 1-μm confocal sections, Gaussian filtered, and contrast enhanced. Bar, 5 μm.
Figure 4.
Figure 4.
FRAP of unliganded erbB1-eGFP on filopodia and cell membrane. (A) Frame before bleaching; (B) first frame after bleaching; (C) frame 10 s into the recovery curve. Arrows indicate the photobleached regions. Bar, 5 μm.
Figure 5.
Figure 5.
Oligomerization is required for retrograde transport. (A) Selected frames of an A431-erbB1-eGFP cell (green) from a time series after binding 5 pM EGF-QD (red) followed by addition of free EGF (50 ng/ml) at 300 s. Bar, 5 μm. Images are contrast enhanced. (B) Trajectory of the indicated monomer EGF-QD–erbB1 complex (A, arrowhead) on a filopodium that exhibits random diffusional movement (black) until the addition of unlabeled EGF (green box), after which the complex commences active retrograde transport (red). (C) Trajectory of EGF-QD–erbB1 complex on a filopodium of an A431 cell. The locus initially undergoes diffusion (black) before active transport begins (red). (D) Plot of intensity versus time of the locus in the trajectory in C. See also Video 4, available at http://www.jcb.org/cgi/content/full/jcb.200503140/DC1. (E) Time series of two different colored EGF-QD–erbB1 complexes (EGF-QD525 tracked by green arrowhead and EGF-QD605 tracked by red arrowhead) on a single filopodium of an A431 cell showing merging (yellow arrowhead) followed by transport to the cell body (bottom left). See also Video 5, available at http://www.jcb.org/cgi/content/full/jcb.200503140/DC1. Bar, 5 μm. Images are contrast enhanced. (F) Trajectory of the two loci in D before and after dimerization.
Figure 6.
Figure 6.
EGF-QD–erbB1s undergo retrograde transport before endocytosis. (A) Two images selected from a time series just before (left) and after (right) addition of biocytin-Alexa 594 (biotA594) to EGF-QDs undergoing retrograde transport on the filopodia of A431 cells. (right) Relative fluorescence intensity over time of the EGF-QD in the yellow box undergoing transport, demonstrating strong quenching. Bar, 10 μm. (B) Cartoon depicting the experiment: at the loading ratio of EGF/QD used, there are still free sites on the streptavidin conjugate layer available for biotin-acceptor (pink), the binding of which results in FRET-induced quenching of the QD donor fluorescence and concomitant sensitized emission of the acceptor fluorescence. (C) Sensitized emission localizes the sites of internalization to the base of the filopodia. (left) EGF-QD525–erbB1 complexes (green) in the cell membrane being transported on the filopodia (arrows). (right) Upon addition of biotA546, the QD signal is quenched and the sensitized emission of the acceptor (red) can be seen on the filopodial loci and the cell surface (*), whereas the complexes already internalized remain green. Images are maximum intensity projections of two 1.0-μm optical sections, Gaussian filtered, and contrast enhanced. Bar, 10 μm.
Figure 7.
Figure 7.
Schematic depiction of filopodial retrograde transport of erbB1. See text for details.

Similar articles

Cited by

References

    1. Axelrod, D., D. Koppel, J. Schlessinger, E. Elson, and W. Webb. 1976. Mobility measurement by analysis of fluorescence photobleaching recovery kinetics. Biophys. J. 16:1055–1069. - PMC - PubMed
    1. Brock, R., and T.M. Jovin. 2001. Heterogeneity of signal transduction at the subcellular level: microsphere-based focal EGF receptor activation and stimulation of Shc translocation. J. Cell Sci. 114:2437–2447. - PubMed
    1. Brock, R., and T.M. Jovin. 2003. Quantitative image analysis of cellular protein translocation induced by magnetic microspheres: application to the EGF receptor. Cytometry. 52:1–11. - PubMed
    1. Brock, R., I.H.L. Hamelers, and T.M. Jovin. 1999. a. Comparison of fixation protocols for adherent cultured cells applied to a GFP fusion protein of the epidermal growth factor receptor. Cytometry. 35:353–362. - PubMed
    1. Brock, R., G. Vamosi, G. Vereb, and T.M. Jovin. 1999. b. Rapid characterization of green fluorescent protein fusion proteins on the molecular and cellular level by fluorescence correlation microscopy. Proc. Natl. Acad. Sci. USA. 96:10123–10128. - PMC - PubMed

Publication types

MeSH terms