

Unifying the spatial population dynamics and molecular evolution of epidemic rabies virus
- PMID: 16103358
- PMCID: PMC1186024
- DOI: 10.1073/pnas.0500057102
Unifying the spatial population dynamics and molecular evolution of epidemic rabies virus
Abstract
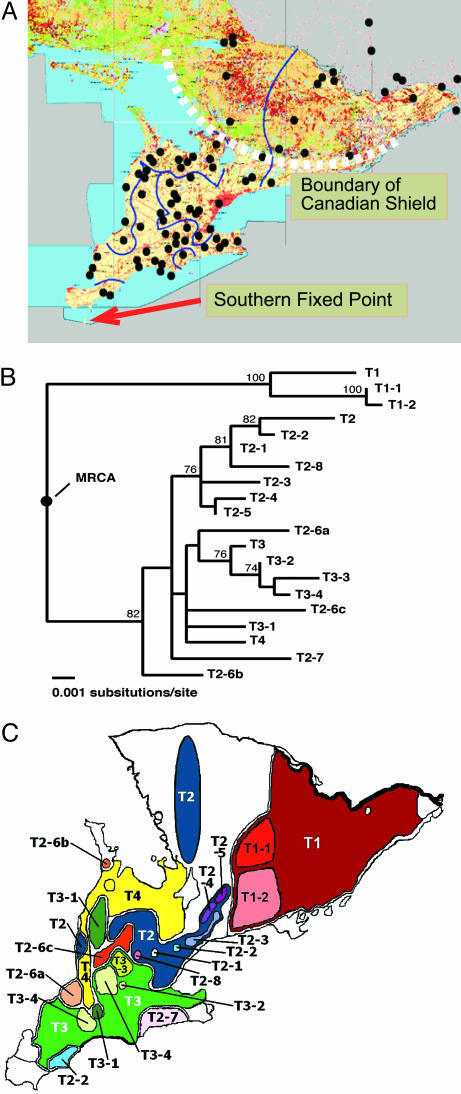
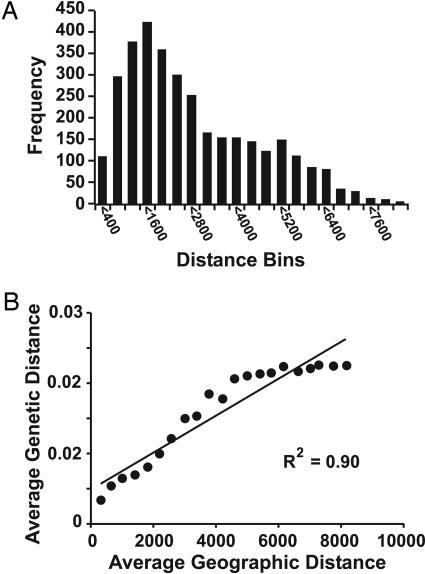
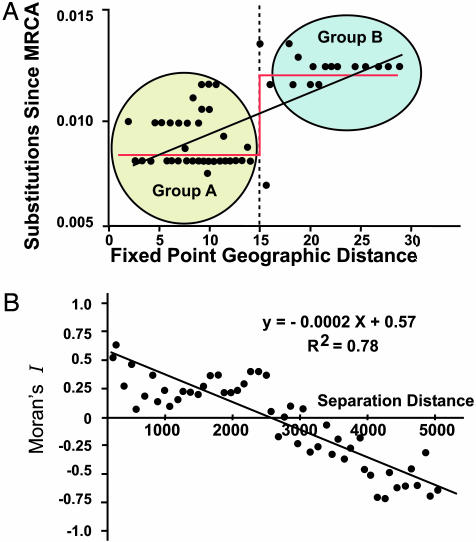
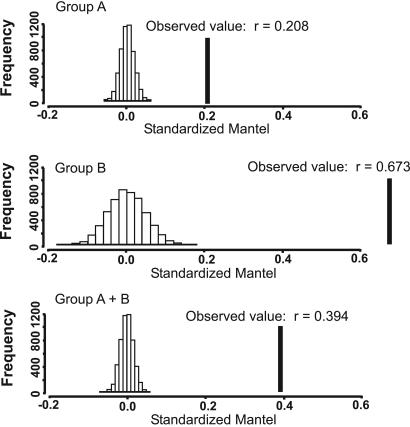
Infectious disease emergence is under the simultaneous influence of both genetic and ecological factors. Yet, we lack a general framework for linking ecological dynamics of infectious disease with underlying molecular and evolutionary change. As a model, we illustrate the linkage between ecological and evolutionary dynamics in rabies virus during its epidemic expansion into eastern and southern Ontario. We characterized the phylogeographic relationships among 83 isolates of fox rabies virus variant using nucleotide sequences from the glycoprotein-encoding glycoprotein gene. The fox rabies virus variant descended as an irregular wave with two arms invading from northern Ontario into southern Ontario over the 1980s and 1990s. Correlations between genetic and geographic distance suggest an isolation by distance population structure for the virus. The divergence among viral lineages since the most recent common ancestor correlates with position along the advancing wave front with more divergent lineages near the origin of the epidemic. Based on divergence from the most recent common ancestor, the regional population can be partitioned into two subpopulations, each corresponding to an arm of the advancing wave. Subpopulation A (southern Ontario) showed reduced isolation by distance relative to subpopulation B (eastern Ontario). The temporal dynamics of subpopulation A suggests that the subregional viral population may have undergone several smaller waves that reduced isolation by distance. The use of integrated approaches, such as the geographical analysis of sequence variants, coupled with information on spatial dynamics will become indispensable aids in understanding patterns of disease emergence.
Figures
References
-
- Asokan, G., Vasanthan, A. & Prabhakaran, V. (2003) Indian J. Anim. Sci. 73, 337-341.
-
- Daszak, P., Cunningham, A. A. & Hyatt, A. D. (2000) Science 287, 443-449. - PubMed
-
- Smolinski, M. S., Hamburg, A. A. & Lederberg, J. (2003) Microbial Threats to Health: Emergence, Detection, and Response (Natl. Acad. Press, Washington, DC). - PubMed
-
- Domingo, E., Webster, R. & Holland, J. (1999) Origin and Evolution of Viruses (Academic, San Diego).
Publication types
MeSH terms
Substances
Grants and funding
LinkOut - more resources
Full Text Sources
Medical
