. 2005 Jun;1(1):e3.
doi: 10.1371/journal.pcbi.0010003. Epub 2005 Jun 24.

Predicting functional gene links from phylogenetic-statistical analyses of whole genomes

Affiliations

Predicting functional gene links from phylogenetic-statistical analyses of whole genomes

Daniel Barker et al. PLoS Comput Biol. 2005 Jun.

Abstract

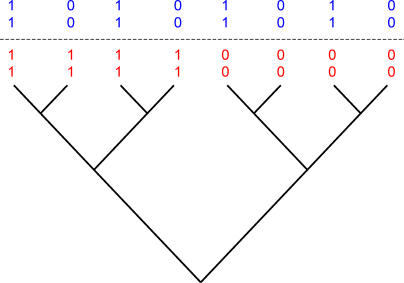
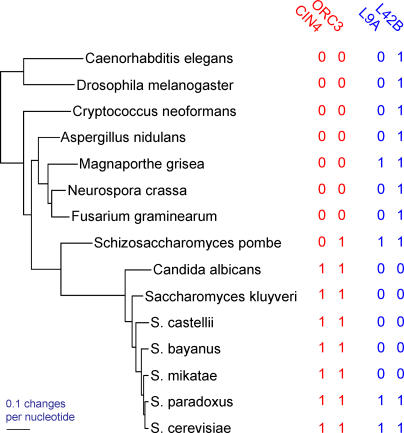
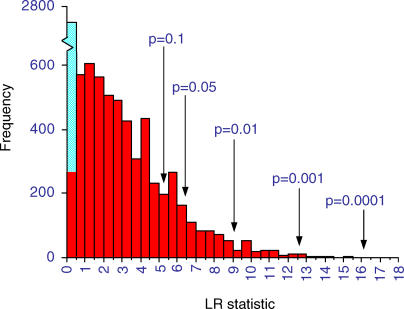
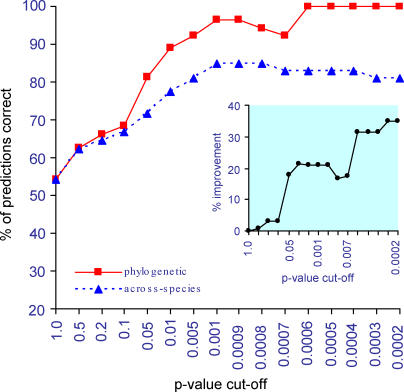
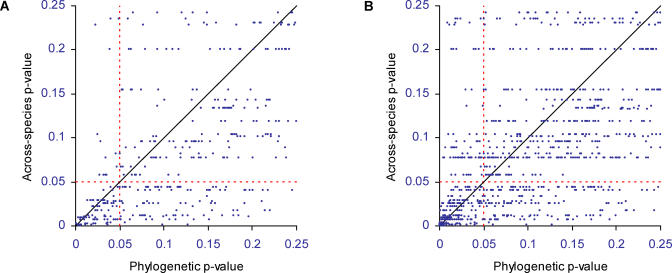
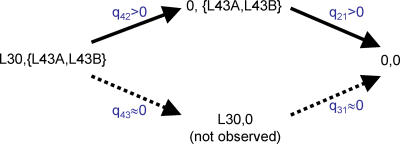
An important element of the developing field of proteomics is to understand protein-protein interactions and other functional links amongst genes. Across-species correlation methods for detecting functional links work on the premise that functionally linked proteins will tend to show a common pattern of presence and absence across a range of genomes. We describe a maximum likelihood statistical model for predicting functional gene linkages. The method detects independent instances of the correlated gain or loss of pairs of proteins on phylogenetic trees, reducing the high rates of false positives observed in conventional across-species methods that do not explicitly incorporate a phylogeny. We show, in a dataset of 10,551 protein pairs, that the phylogenetic method improves by up to 35% on across-species analyses at identifying known functionally linked proteins. The method shows that protein pairs with at least two to three correlated events of gain or loss are almost certainly functionally linked. Contingent evolution, in which one gene's presence or absence depends upon the presence of another, can also be detected phylogenetically, and may identify genes whose functional significance depends upon its interaction with other genes. Incorporating phylogenetic information improves the prediction of functional linkages. The improvement derives from having a lower rate of false positives and from detecting trends that across-species analyses miss. Phylogenetic methods can easily be incorporated into the screening of large-scale bioinformatics datasets to identify sets of protein links and to characterise gene networks.


Conflict of interest statement

Competing interests. The authors have declared that no competing interests exist.

Figures

Figure 1
Figure 1. Across-Species Correlation Confuses Shared Inheritance with Correlated Evolution but Phylogenetic Method Does Not
The figure shows a hypothetical phylogeny of eight species. Assume all four genes were present in the common ancestor. Only the top (blue) pair provides statistical evidence for correlated evolution. The apparent correlation in the bottom (red) pair arises from shared inheritance of the loss (state “0”) of both genes in the ancestor to the four species on the right of the diagram. Although the two genes were lost at the same time, it may have been for unrelated reasons. By comparison, the correlation in the top pair rests upon four separate events of the correlated loss of both genes. Both genes are retained until near the tips of the tree, at which point both are lost in each of four separate species. It is unlikely that two genes would be simultaneously lost on four independent occasions, unless the two genes were functionally linked. A simple across-species correlation does not discriminate between these two scenarios, whereas one that accounts for phylogeny does. This is an extreme scenario but many others are possible.
Figure 2
Figure 2. Phylogeny of the 15 Species Showing Two Pairs of Presence/Absence Data for Proteins in MIPS
All nodes of the tree received 100% posterior support in an MCMC analysis (see Results). The protein pairs {CIN4, ORC3} and {L9A, L42B}, marked “1” for presence and “0” for absence, are included to illustrate probable type I (false positive) and type II (false negative) errors by the across-species method in real data (see Results, “False positives”). Probable false positive: The across-species correlation returns a significant (p = 0.0014) correlation between the pair {CIN4, ORC3}. The phylogenetic method regards this as a chance association (p = 0.13) arising from a single event of both genes being gained in the ascomycete yeasts, followed by shared inheritance (as in Figure 1). The pair {L9A, L42B} consists of two functionally linked proteins. These return a significant phylogenetic correlation (p = 0.035) owing to perhaps five correlated losses of both genes (see text). The across-species association is sensitive only to the distribution of the two proteins across the tips, and returns a non-significant result (p = 0.23). This is a probable false negative.
Figure 3
Figure 3. Distribution of 8,102 LRs for MIPS Pairs, Measuring the Strength of Support for the Phylogenetic Correlation
Critical p-value cut-off points are derived from the random pairs data (see Results). The blue bar within the first class represents the 2,483 pairs for which one or both proteins were present in all 15 species (LR ≈ 0). The red bars record the remaining 5,619 LRs for pairs of proteins that both vary across species. Approximately 8% of the results exceed the p ≤ 0.05 level. Two pairs have LRs greater than 15.5 but are not visible on the graph. The excess of LR scores of 4–4.5 and 5.5–6 may arise from misidentified homology in S. kluyveri. This species is identified as having a smaller number of genes than its phylogenetic neighbours. These paired absences will tend to inflate correlations. We left these results in our analyses, as they affect the phylogenetic and across-species analyses equally, and we cannot be sure which absences are real and which are not.
Figure 4
Figure 4. Phylogenetic Method Identifies a Higher Percentage of Functional Links than the Across-Species Correlation
The main graph shows the percentage of the predicted links at or below a given p-value, that correspond to annotated functionally linked pairs in the MIPS database, separately for the two methods. At a p-value of 1.0 or less, both methods declare all of the pairs to be functionally linked, producing a correct percentage of 54% (see Results). Inset: the percentage by which the phylogenetic method improves upon the across-species correlation, where improvement = (percent correct phylogenetic − percent correct across-species)/54.
Figure 5
Figure 5. Phylogenetic Method Results in Fewer False-Positives than the Across-Species Correlation
The across-species p-value (y-axis) is plotted against the phylogenetic method's p-value (x-axis) for the range of p = 0–0.25; the methods draw similar conclusions for p-values greater than 0.25. (A) Higher rates of probable false positives for the across-species correlation. The horizontal dashed line defines the region in which the across-species method declares pairs significant (n = 170) but the phylogenetic method finds no evidence for a functional link. The vertical dashed line defines the same region for the phylogenetic method (n = 32). (B) Same relationship as in (A) but for the MIPS pairs of annotated links. The across-species correlation returns a functional link for n = 278 pairs that the phylogenetic method declares non-significant. Many of these may be false positives arising from chance events (see Results). The phylogenetic method finds n = 186 extra pairs significant. Especially at lower p-values, these are unlikely to be false positives (see Results) (Figure 4).
Figure 6
Figure 6. Detecting Contingent Evolution Between Two Proteins
Protein L30 is significantly linked across species to L43A and L43B (both LRs = 9.73, p < 0.007). The three are present together in nine of the species, and are probably ancestral to the group represented by the phylogeny in Figure 2. The diagram represents the probable ancestral states on the left side. Solid arrows indicate the most likely events of evolution to other evolutionary states, and dashed arrows correspond to events for which no statistical support is found. L30 can be lost (q42 > 0), leaving L43 and L43B remaining, and this happens in two species. Once L30 is lost, the other two proteins follow (q21 > 0), yielding the remaining four species in which both proteins are absent. In comparison, L43A and L43B are never lost in the presence of L30. This suggests a contingent relationship amongst these proteins such that L43A and L43B seem to derive their functions only in the presence of L30.

References

    1. Pellegrini M, Marcotte EM, Thompson MJ, Eisenberg D, Yeates TO. Assigning protein functions by comparative genome analysis: Protein phylogenetic profiles. Proc Natl Acad Sci U S A. 1999;96:4285–4288. - PMC - PubMed
    1. Eisenberg D, Marcotte EM, Xenarios I, Yeates TO. Protein function in the post-genomic era. Nature. 2000;405:823–826. - PubMed
    1. Date SV, Marcotte EM. Discovery of uncharacterized cellular systems by genome-wide analysis of functional linkages. Nat Biotechnol. 2003;21:1055–1062. - PubMed
    1. Fraser HB, Hirsh AE, Wall DP, Eisen MB. Coevolution of gene expression among interacting proteins. Proc Natl Acad Sci U S A. 2004;101:9033–9038. - PMC - PubMed
    1. Pazos F, Valencia A. Similarity of phylogenetic trees as indicator of protein-protein interaction. Protein Eng. 2001;14:609–614. - PubMed