Comparative Study
. 2005 Nov 30;165(1):110-25.
doi: 10.1016/j.bbr.2005.06.026. Epub 2005 Aug 18.

Perturbation of chemokine networks by gene deletion alters the reinforcing actions of ethanol

Affiliations
Comparative Study

Perturbation of chemokine networks by gene deletion alters the reinforcing actions of ethanol

Yuri A Blednov et al. Behav Brain Res. .

Abstract

Microarray analysis of human alcoholic brain and cultured cells exposed to ethanol showed significant changes in expression of genes related to immune or inflammatory responses, including chemokines and chemokine receptors. To test the hypothesis that chemokines exhibit previously undiscovered pleiotropic effects important for the behavioral actions of ethanol, we studied mutant mice with deletion of the Ccr2, Ccr5, Ccl2 or Ccl3 genes. Deletion of Ccr2, Ccl2 (females) or Ccl3 in mice resulted in lower preference for alcohol and consumption of lower amounts of alcohol in a two-bottle choice test as compared with wild-type mice. Ethanol treatment (2.5 g/kg, i.p.) induced stronger conditioned taste aversion in Ccr2, Ccl2 or Ccl3 null mutant mice than in controls. Ccr2 and Ccr5 null mutant mice did not differ from wild-type mice in ethanol-induced loss of righting reflex (LORR), but mice lacking Ccl2 or Ccl3 showed longer LORR than wild-type mice. There were no differences between mutant strains and wild-type mice in severity of ethanol-induced withdrawal. Genetic mapping of chromosome 11 for the Ccl2 and Ccl3 genes (46.5 and 47.6 cM, respectively) revealed that an alcohol-induced LORR QTL region was contained within the introgressed region derived from 129/SvJ, which may cause some behavioral phenotypes observed in the null mice. On the contrary, known QTLs on Chr 9 are outside of 129/SvJ region in Ccr2 and Ccr5 (71.9 and 72.0 cM, respectively) null mutant mice. These data show that disruption of the chemokine network interferes with motivational effects of alcohol.


Figures
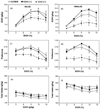
Fig. 1
Fig. 1
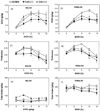
Voluntary ethanol consumption in Ccr2 (−/−) and Ccr5 (−/−) knockout mice. (a) Males: amount of consumed ethanol (g/kg). (b) Males: preference for ethanol. (c) Males: total fluid intake (g/kg). (d) Females: amount of consumed ethanol (g/kg). (e) Females: preference for ethanol. (f) Females: total fluid intake (g/kg); n = 12–15 for each male genotypes and n = 10–18 for each female genotypes.
Fig. 2
Fig. 2
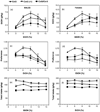
Voluntary ethanol consumption in Ccl2 (−/−) and Ccl3 (−/−) knockout mice. (a) Males: amount of consumed ethanol (g/kg). (b) Males: preference for ethanol. (c) Males: total fluid intake (g/kg). (d) Females: amount of consumed ethanol (g/kg). (e) Females: preference for ethanol. (f) Females: total fluid intake (g/kg); n = 10–20 for each genotype and sex.
Fig. 3
Fig. 3
Voluntary ethanol consumption in Ccr2 (−/−), Ccl2 (−/−) and double Ccl2 (−/−)/Ccr2 (−/−) knockout mice. (a) Males: amount of consumed ethanol (g/kg). (b) Females: amount of consumed ethanol (g/kg). (c) Males: preference for ethanol. (d) Females: preference for ethanol. (e) Males: total fluid intake (g/kg). (f) Females: total fluid intake (g/kg); n = 10–15 for each male genotypes and n = 8–10 for each female genotypes.
Fig. 4
Fig. 4
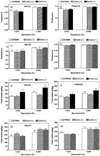
Voluntary saccharin consumption in Ccr2 (−/−), Ccr5 (−/−), Ccl2 (−/−) and Ccl3 (−/−) knockout mice. (a) Males: preference for saccharin, Ccr2 (−/−) and Ccr5 (−/−) knockout mice. (b) Females: preference for saccharin, Ccr2 (−/−) and Ccr5 (−/−) knockout mice. (c) Males: preference for saccharin, Ccl2 (−/−) and Ccl3 (−/−) knockout mice. (d) Females: preference for saccharin, Ccl2 (−/−) and Ccl3 (−/−) knockout mice. (e) Males: total fluid intake (g/kg), Ccr2 (−/−) and Ccr5 (−/−) knockout mice. (f) Females: total fluid intake (g/kg), Ccr2 (−/−) and Ccr5 (−/−) knockout mice. (g) Males: total fluid intake (g/kg), Ccl2 (−/−) and Ccl3 (−/−) knockout mice. (h) Females: total fluid intake (g/kg), Ccl2 (−/−) and Ccl3 (−/−) knockout mice; n = 10–12 for each male genotypes and n = 8–10 for each female genotypes.
Fig. 5
Fig. 5
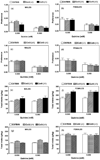
Voluntary quinine consumption in Ccr2 (−/−), Ccr5 (−/−), Ccl2 (−/−) and Ccl3 (−/−) knockout mice. (a) Males: preference for quinine, Ccr2 (−/−) and Ccr5 (−/−) knockout mice. (b) Females: preference for quinine, Ccr2 (−/−) and Ccr5 (−/−) knockout mice. (c) Males: preference for quinine, Ccl2 (−/−) and Ccl3 (−/−) knockout mice. (d) Females: preference for quinine, Ccl2 (−/−) and Ccl3 (−/−) knockout mice. (e) Males: total fluid intake (g/kg), Ccr2 (−/−) and Ccr5 (−/−) knockout mice. (f) Females: total fluid intake (g/kg), Ccr2 (−/−) and Ccr5 (−/−) knockout mice. (g) Males: total fluid intake (g/kg), Ccl2 (−/−) and Ccl3 (−/−) knockout mice. (h) Females: total fluid intake (g/kg), Ccl2 (−/−) and Ccl3 (−/−) knockout mice; n = 10–12 for each male genotypes and n = 8–10 for each female genotypes.
Fig. 6
Fig. 6
Ethanol-induced conditioned taste aversion in Ccr2 (−/−) and Ccr5 (−/−) null mutant mice. (a) Males: n = 14–16 for saline injection for all genotypes; n = 13–23 for groups with ethanol injection. (b) Females: n = 10–19 for saline injection for all genotypes; n = 9–20 for groups with ethanol injection.
Fig. 7
Fig. 7
Ethanol-induced conditioned taste aversion in Ccl2 (−/−) and Ccl3 (−/−) null mutant mice. (a) Males: n = 7–13 for saline injection for all genotypes; n = 12–14 for groups with ethanol injection. (b) Females: n = 7–14 for saline injection for all genotypes; n = 12–15 for groups with ethanol injection.
Fig. 8
Fig. 8
Duration of ethanol-induced LORR in Ccl2 (−/−), Ccl3 (−/−), Ccr2 (−/−) and Ccr5 null mutant mice. (a) Males: *P < 0.05; **P < 0.01, statistically significant differences from wild-type mice (Student’s t-test); n = 24 for wild-type mice and n = 11–13 for all knockout strains. (b) Females: **P < 0.01; ***P < 0.001, statistically significant differences from wild-type mice (Student’s t-test); n = 10–11 for all strains.
Fig. 9
Fig. 9
Severity of ethanol-induced withdrawal in Ccl2 (−/−), Ccl3 (−/−), Ccr2 (−/−) and Ccr5 (−/−) null mutant mice. (a and b) HIC scores for male mice; n = 7–8 for all strains. (c and d) HIC scores for female mice; n = 7–8 for all strains.

References

    1. Andres PG, Beck PL, Mizoguchi E, Mizoguchi A, Bhan AK, Dawson T, et al. Mice with a selective deletion of the CC chemokine receptors 5 or 2 are protected from dextran sodium sulfate-mediated colitis: lack of CC chemokine receptor 5 expression results in a NK1.1 + lymphocyte-associated Th2-type immune response in the intestine. J Immunol. 2000;164:6303–6312. - PubMed
    1. Asensio VC, Campbell IL. Chemokines in the CNS: plurifunctional mediators in diverse states. Trends Neurosci. 1999;22:504–512. - PubMed
    1. Baggiolini M. Chemokines in pathology and medicine. J Intern Med. 2001;250:91–104. - PubMed
    1. Bagri A, Gurney T, He X, Zou YR, Littman DR, Tessier-Lavigne M, et al. The chemokine SDF1 regulates migration of dentate granule cells. Development. 2002;129:4249–4260. - PubMed
    1. Bajetto A, Barbero S, Bonavia R, Piccioli P, Pirani P, Florio T, et al. Stromal cell-derived factor-1 alpha induces astrocyte proliferation through the activation of extracellular signal-regulated kinases 1/2 pathway. J Neurochem. 2001;77:1226–1236. - PubMed

Publication types

MeSH terms