

Provocation of sudden heart rate oscillation with adenosine exposes abnormal QT responses in patients with long QT syndrome: a bedside test for diagnosing long QT syndrome
- PMID: 16105845
- PMCID: PMC1474076
- DOI: 10.1093/eurheartj/ehi460
Provocation of sudden heart rate oscillation with adenosine exposes abnormal QT responses in patients with long QT syndrome: a bedside test for diagnosing long QT syndrome
Abstract
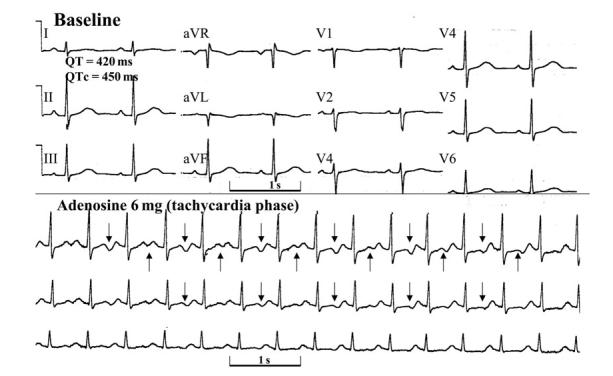
Aims: As arrhythmias in the long QT syndrome (LQTS) are triggered by heart rate deceleration or acceleration, we speculated that the sudden bradycardia and subsequent tachycardia that follow adenosine injection would unravel QT changes of diagnostic value in patients with LQTS.
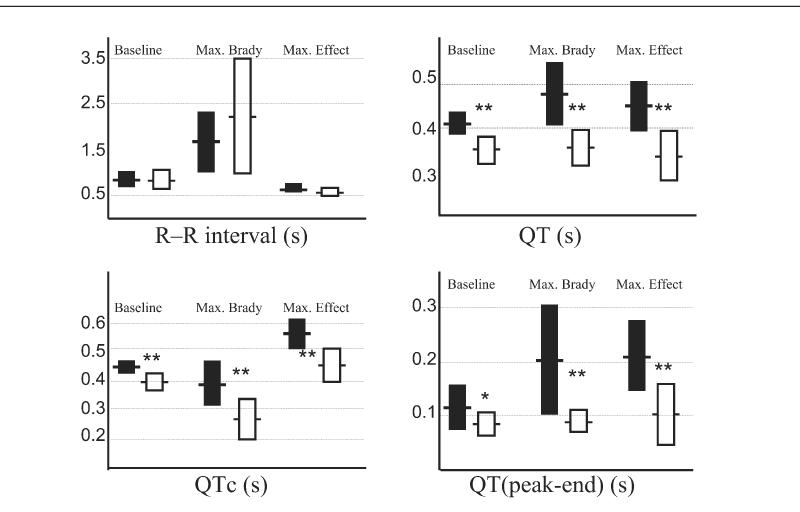
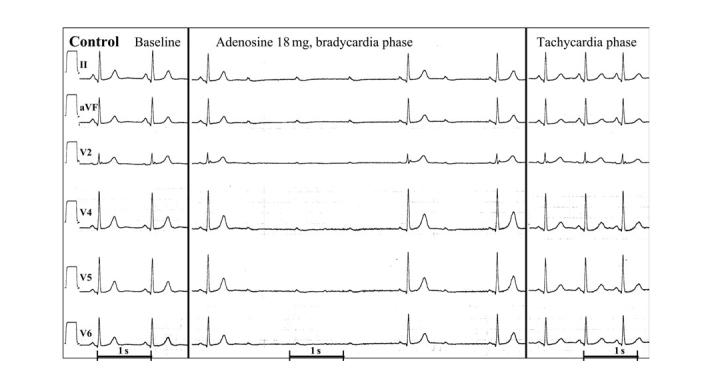
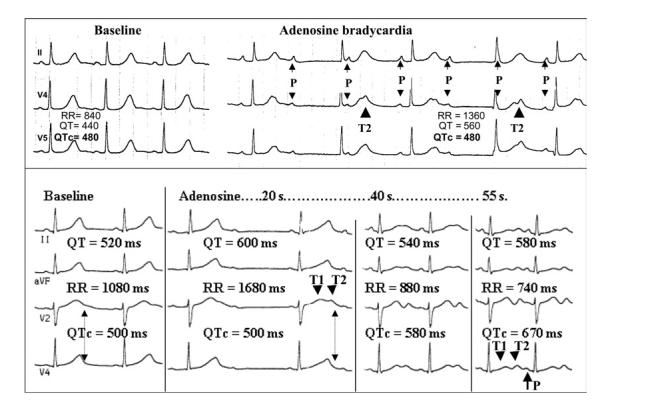
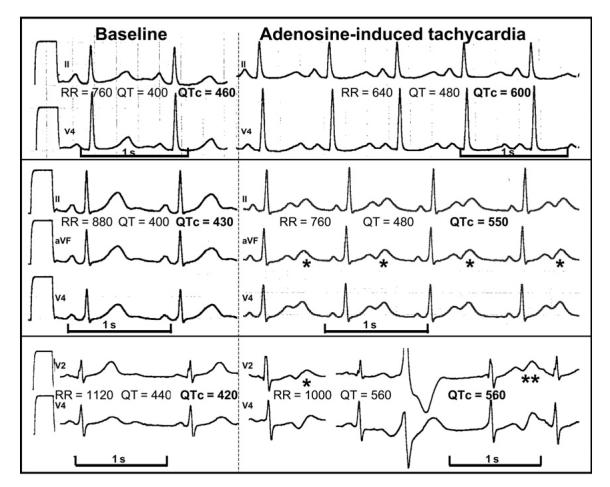
Methods and results: Patients (18 LQTS and 20 controls) received intravenous adenosine during sinus rhythm. Adenosine was injected at incremental doses until atrioventricular block or sinus pauses lasting 3 s occurred. The QT duration and morphology were studied at baseline and at the time of maximal bradycardia and subsequent tachycardia. Despite similar degree of adenosine-induced bradycardia (longest R-R 1.7+/-0.7 vs. 2.2+/-1.3 s for LQTS and controls, P=NS), the QT interval of LQT patients increased by 15.8+/-13.1%, whereas the QT of controls increased by only 1.5+/-6.7% (P<0.001). Similarly, despite similar reflex tachycardia (shortest R-R 0.58+/-0.07 vs. 0.55+/-0.07 s for LQT patients and controls, P=NS), LQTS patients developed greater QT prolongation (QTc=569+/-53 vs. 458+/-58 ms for LQT patients and controls, P<0.001). The best discriminator was the QTc during maximal bradycardia. Notched T-waves were observed in 72% of LQT patients but in only 5% of controls during adenosine-induced bradycardia (P<0.001).
Conclusion: By provoking transient bradycardia followed by sinus tachycardia, this adenosine challenge test triggers QT changes that appear to be useful in distinguishing patients with LQTS from healthy controls.
Figures
Comment in
-
Abnormal QT responses to adenosine in subjects with long-QT syndrome.Eur Heart J. 2006 Jul;27(14):1759-60; author reply 1760. doi: 10.1093/eurheartj/ehl073. Epub 2006 Jun 6. Eur Heart J. 2006. PMID: 16757492 No abstract available.
Similar articles
-
Diagnostic value of T-wave morphology changes during "QT stretching" in patients with long QT syndrome.Heart Rhythm. 2015 Nov;12(11):2263-71. doi: 10.1016/j.hrthm.2015.06.040. Epub 2015 Jun 30. Heart Rhythm. 2015. PMID: 26142298
-
Epinephrine-induced QT interval prolongation: a gene-specific paradoxical response in congenital long QT syndrome.Mayo Clin Proc. 2002 May;77(5):413-21. doi: 10.4065/77.5.413. Mayo Clin Proc. 2002. PMID: 12004990 Clinical Trial.
-
The response of the QT interval to the brief tachycardia provoked by standing: a bedside test for diagnosing long QT syndrome.J Am Coll Cardiol. 2010 May 4;55(18):1955-61. doi: 10.1016/j.jacc.2009.12.015. Epub 2010 Jan 29. J Am Coll Cardiol. 2010. PMID: 20116193 Free PMC article.
-
Long QT syndrome and short QT syndrome.Prog Cardiovasc Dis. 2008 Nov-Dec;51(3):264-78. doi: 10.1016/j.pcad.2008.10.006. Prog Cardiovasc Dis. 2008. PMID: 19026859 Review.
-
[Prevention of sudden death in congenital long-QT syndrome].Rev Port Cardiol. 1999 Jun;18(6):627-33. Rev Port Cardiol. 1999. PMID: 10422460 Review. Portuguese.
Cited by
-
Adenosine and the Cardiovascular System: The Good and the Bad.J Clin Med. 2020 May 6;9(5):1366. doi: 10.3390/jcm9051366. J Clin Med. 2020. PMID: 32384746 Free PMC article. Review.
-
Contributions of Israel to the field of clinical cardiac electrophysiology and implantable devices.Heart Rhythm O2. 2024 Feb 21;5(2):67-84. doi: 10.1016/j.hroo.2023.11.006. eCollection 2024 Feb. Heart Rhythm O2. 2024. PMID: 38545322 Free PMC article. No abstract available.
-
Characterization of the cardiac sodium channel SCN5A mutation, N1325S, in single murine ventricular myocytes.Biochem Biophys Res Commun. 2007 Jan 12;352(2):378-83. doi: 10.1016/j.bbrc.2006.11.019. Epub 2006 Nov 14. Biochem Biophys Res Commun. 2007. PMID: 17118339 Free PMC article.
-
Novel mutation in the SCN5A gene associated with arrhythmic storm development during acute myocardial infarction.Heart Rhythm. 2007 Aug;4(8):1072-80. doi: 10.1016/j.hrthm.2007.03.040. Epub 2007 Apr 10. Heart Rhythm. 2007. PMID: 17675083 Free PMC article.
-
The phenomenon of "QT stunning": the abnormal QT prolongation provoked by standing persists even as the heart rate returns to normal in patients with long QT syndrome.Heart Rhythm. 2012 Jun;9(6):901-8. doi: 10.1016/j.hrthm.2012.01.026. Epub 2012 Jan 31. Heart Rhythm. 2012. PMID: 22300664 Free PMC article.
References
-
- Viskin S. The long QT syndromes and torsade de pointes. Lancet. 1999;354:1625–1633. - PubMed
-
- Moss AJ. Long QT syndrome. JAMA. 2003;289:2041–2044. - PubMed
-
- Vincent GM, Timothy KW, Leppert M, Keating M. The spectrum of symptoms and QT intervals in carriers of the gene for the long QT syndrome. N Engl J Med. 1992;327:846–852. - PubMed
-
- Allan WC, Timothy K, Vincent GM, Palomaki GE, Neveux LM, Haddow JE. Long QT syndrome in children: the value of rate corrected QT interval and DNA analysis as screening tests in the general population. J Med Screen. 2001;8:173–177. - PubMed
Publication types
MeSH terms
Substances
Grants and funding
LinkOut - more resources
Full Text Sources
Other Literature Sources
Medical
Research Materials
Miscellaneous
