Decreased insulin-dependent glucose transport by chronic ethanol feeding is associated with dysregulation of the Cbl/TC10 pathway in rat adipocytes
- PMID: 16105861
- PMCID: PMC1283127
- DOI: 10.1152/ajpendo.00296.2005
Decreased insulin-dependent glucose transport by chronic ethanol feeding is associated with dysregulation of the Cbl/TC10 pathway in rat adipocytes
Abstract
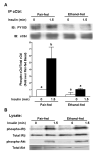
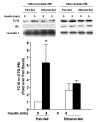
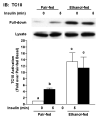
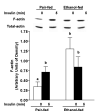
Heavy alcohol consumption is an independent risk factor for type 2 diabetes. Although the exact mechanism by which alcohol contributes to the increased risk is unknown, impaired glucose disposal is a likely target. Insulin-stimulated glucose disposal in adipocytes is regulated by two separate and independent pathways, the PI3K pathway and the Cbl/TC10 pathway. Previous studies suggest that chronic ethanol feeding impairs insulin-stimulated glucose transport in adipocytes in a PI3K-independent manner. In search of potential targets of ethanol that would affect insulin-stimulated glucose transport, we investigated the effects of 4-wk ethanol feeding to male Wistar rats on the Cbl/TC10 pathway in isolated adipocytes. Chronic ethanol feeding inhibited insulin-stimulated cCbl phosphorylation compared with pair feeding. Insulin receptor and Akt/PKB phosphorylation were not affected by ethanol feeding. Chronic ethanol exposure also impaired cCbl and TC10 recruitment to a lipid raft fraction isolated from adipocytes by detergent extraction. Furthermore, chronic ethanol feeding increased the amount of activated TC10 and filamentous actin in adipocytes at baseline and abrogated the ability of insulin to further activate TC10 or polymerize actin. These results demonstrate that the impairment in insulin-stimulated glucose transport observed in adipocytes after chronic ethanol feeding to rats is associated with a disruption of insulin-mediated Cbl/TC10 signaling and actin polymerization.
Figures


Similar articles
-
Skeletal muscle cells and adipocytes differ in their reliance on TC10 and Rac for insulin-induced actin remodeling.Mol Endocrinol. 2004 Feb;18(2):359-72. doi: 10.1210/me.2003-0294. Epub 2003 Nov 13. Mol Endocrinol. 2004. PMID: 14615606
-
Insulin-stimulated GLUT4 translocation requires the CAP-dependent activation of TC10.Nature. 2001 Apr 19;410(6831):944-8. doi: 10.1038/35073608. Nature. 2001. PMID: 11309621
-
Requirements for pYXXM motifs in Cbl for binding to the p85 subunit of phosphatidylinositol 3-kinase and Crk, and activation of atypical protein kinase C and glucose transport during insulin action in 3T3/L1 adipocytes.Biochemistry. 2004 Dec 14;43(49):15494-502. doi: 10.1021/bi049222q. Biochemistry. 2004. PMID: 15581361
-
Insulin regulation of glucose uptake: a complex interplay of intracellular signalling pathways.Diabetologia. 2002 Nov;45(11):1475-83. doi: 10.1007/s00125-002-0974-7. Epub 2002 Oct 18. Diabetologia. 2002. PMID: 12436329 Review.
-
Insulin signaling in microdomains of the plasma membrane.Traffic. 2003 Nov;4(11):711-6. doi: 10.1034/j.1600-0854.2003.00119.x. Traffic. 2003. PMID: 14617354 Review.
Cited by
-
Chronic ethanol feeding to rats decreases adiponectin secretion by subcutaneous adipocytes.Am J Physiol Endocrinol Metab. 2007 Feb;292(2):E621-8. doi: 10.1152/ajpendo.00387.2006. Epub 2006 Oct 17. Am J Physiol Endocrinol Metab. 2007. PMID: 17047161 Free PMC article.
-
The range of time delay and the global stability of the equilibrium for an IVGTT model.Math Biosci. 2012 Feb;235(2):128-37. doi: 10.1016/j.mbs.2011.11.005. Epub 2011 Nov 19. Math Biosci. 2012. PMID: 22123436 Free PMC article.
-
Chronic ethanol consumption-induced pancreatic {beta}-cell dysfunction and apoptosis through glucokinase nitration and its down-regulation.J Biol Chem. 2010 Nov 26;285(48):37251-62. doi: 10.1074/jbc.M110.142315. Epub 2010 Sep 20. J Biol Chem. 2010. PMID: 20855893 Free PMC article.
-
Therapeutic properties of Scutellaria baicalensis in db/db mice evaluated using Connectivity Map and network pharmacology.Sci Rep. 2017 Jan 31;7:41711. doi: 10.1038/srep41711. Sci Rep. 2017. PMID: 28139721 Free PMC article.
-
Ethanol causes the redistribution of L1 cell adhesion molecule in lipid rafts.J Neurochem. 2011 Nov;119(4):859-67. doi: 10.1111/j.1471-4159.2011.07467.x. Epub 2011 Oct 11. J Neurochem. 2011. PMID: 21884525 Free PMC article.
References
-
- Avogaro A, Tiengo A. Alcohol, glucose metabolism and diabetes. Diabetes Metab Rev. 1993;9:129–46. - PubMed
-
- Bandyopadhyay G, Standaert ML, Galloway L, Moscat J, Farese RV. Evidence for involvement of protein kinase C (PKC)-zeta and noninvolvement of diacylglycerol-sensitive PKCs in insulin-stimulated glucose transport in L6 myotubes. Endocrinology. 1997;138:4721–31. - PubMed
-
- Bandyopadhyay G, Standaert ML, Zhao L, Yu B, Avignon A, Galloway L, Karnam P, Moscat J, Farese RV. Activation of protein kinase C (alpha, beta, and zeta) by insulin in 3T3/L1 cells. Transfection studies suggest a role for PKC-zeta in glucose transport. J Biol Chem. 1997;272:2551–8. - PubMed
-
- Baumann CA, Ribon V, Kanzaki M, Thurmond DC, Mora S, Shigematsu S, Bickel PE, Pessin JE, Saltiel AR. CAP defines a second signalling pathway required for insulin-stimulated glucose transport. Nature. 2000;407:202–7. - PubMed
Publication types
MeSH terms
Substances
Grants and funding
LinkOut - more resources
Full Text Sources
Medical
Molecular Biology Databases
Miscellaneous

