

Simple decision rules for classifying human cancers from gene expression profiles
- PMID: 16105897
- PMCID: PMC1987374
- DOI: 10.1093/bioinformatics/bti631
Simple decision rules for classifying human cancers from gene expression profiles
Abstract
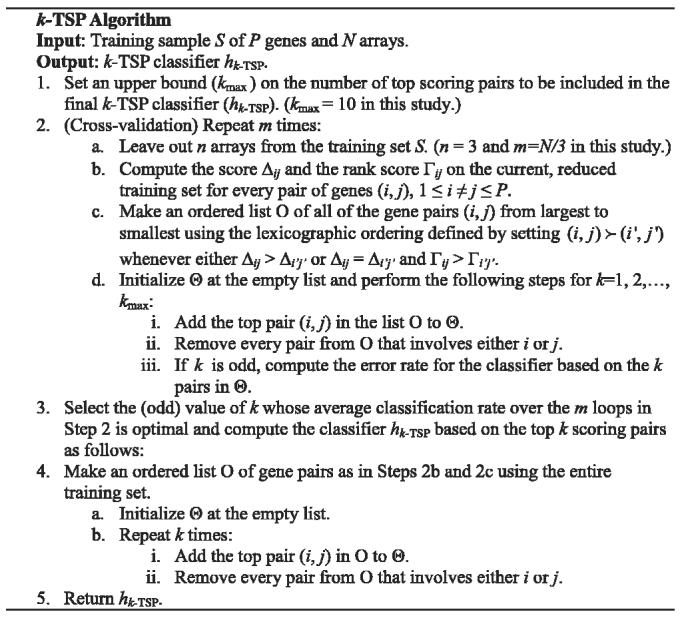
Motivation: Various studies have shown that cancer tissue samples can be successfully detected and classified by their gene expression patterns using machine learning approaches. One of the challenges in applying these techniques for classifying gene expression data is to extract accurate, readily interpretable rules providing biological insight as to how classification is performed. Current methods generate classifiers that are accurate but difficult to interpret. This is the trade-off between credibility and comprehensibility of the classifiers. Here, we introduce a new classifier in order to address these problems. It is referred to as k-TSP (k-Top Scoring Pairs) and is based on the concept of 'relative expression reversals'. This method generates simple and accurate decision rules that only involve a small number of gene-to-gene expression comparisons, thereby facilitating follow-up studies.
Results: In this study, we have compared our approach to other machine learning techniques for class prediction in 19 binary and multi-class gene expression datasets involving human cancers. The k-TSP classifier performs as efficiently as Prediction Analysis of Microarray and support vector machine, and outperforms other learning methods (decision trees, k-nearest neighbour and naïve Bayes). Our approach is easy to interpret as the classifier involves only a small number of informative genes. For these reasons, we consider the k-TSP method to be a useful tool for cancer classification from microarray gene expression data.
Availability: The software and datasets are available at http://www.ccbm.jhu.edu
Contact: actan@jhu.edu.
Figures


Similar articles
-
A comprehensive evaluation of multicategory classification methods for microarray gene expression cancer diagnosis.Bioinformatics. 2005 Mar 1;21(5):631-43. doi: 10.1093/bioinformatics/bti033. Epub 2004 Sep 16. Bioinformatics. 2005. PMID: 15374862
-
Robust prostate cancer marker genes emerge from direct integration of inter-study microarray data.Bioinformatics. 2005 Oct 15;21(20):3905-11. doi: 10.1093/bioinformatics/bti647. Epub 2005 Aug 30. Bioinformatics. 2005. PMID: 16131522
-
Kernel-imbedded Gaussian processes for disease classification using microarray gene expression data.BMC Bioinformatics. 2007 Feb 28;8:67. doi: 10.1186/1471-2105-8-67. BMC Bioinformatics. 2007. PMID: 17328811 Free PMC article.
-
Machine learning for detection and diagnosis of disease.Annu Rev Biomed Eng. 2006;8:537-65. doi: 10.1146/annurev.bioeng.8.061505.095802. Annu Rev Biomed Eng. 2006. PMID: 16834566 Review.
-
Relative expression analysis for molecular cancer diagnosis and prognosis.Technol Cancer Res Treat. 2010 Apr;9(2):149-59. doi: 10.1177/153303461000900204. Technol Cancer Res Treat. 2010. PMID: 20218737 Free PMC article. Review.
Cited by
-
Identification of predictive markers of response to the MEK1/2 inhibitor selumetinib (AZD6244) in K-ras-mutated colorectal cancer.Mol Cancer Ther. 2010 Dec;9(12):3351-62. doi: 10.1158/1535-7163.MCT-10-0376. Epub 2010 Oct 5. Mol Cancer Ther. 2010. PMID: 20923857 Free PMC article.
-
Systems biology and cancer stem cells.J Cell Mol Med. 2008 Jan-Feb;12(1):97-110. doi: 10.1111/j.1582-4934.2007.00151.x. Epub 2007 Nov 20. J Cell Mol Med. 2008. PMID: 18031300 Free PMC article. Review.
-
AL101, a gamma-secretase inhibitor, has potent antitumor activity against adenoid cystic carcinoma with activated NOTCH signaling.Cell Death Dis. 2022 Aug 5;13(8):678. doi: 10.1038/s41419-022-05133-9. Cell Death Dis. 2022. PMID: 35931701 Free PMC article.
-
Distinguishing Kawasaki Disease from Febrile Infectious Disease Using Gene Pair Signatures.Biomed Res Int. 2020 Apr 26;2020:6539398. doi: 10.1155/2020/6539398. eCollection 2020. Biomed Res Int. 2020. PMID: 32420360 Free PMC article.
-
A combined gene expression tool for parallel histological prediction and gene fusion detection in non-small cell lung cancer.Sci Rep. 2019 Mar 26;9(1):5207. doi: 10.1038/s41598-019-41585-4. Sci Rep. 2019. PMID: 30914778 Free PMC article. Clinical Trial.
References
-
- Alizadeh AA, et al. Distinct types of diffuse large B-cell lymphoma identified by gene expression profiling. Nature. 2000;403:503–511. - PubMed
-
- Amit Y, Geman D. Shape quantization and recognition with randomized trees. IEEE Trans. Pattern Anal. Machine Intell. 1997;19:1300–1305.
-
- Armstrong S, et al. MLL translocations specify a distinct gene expression profile that distinguishes a unique leukemia. Nat. Genet. 2002;30:41–47. - PubMed
-
- Beer DG, et al. Gene-expression profiles predict survival of patients with lung adenocarcinoma. Nat. Med. 2002;8:816–824. - PubMed
Publication types
MeSH terms
Substances
Grants and funding
LinkOut - more resources
Full Text Sources
Other Literature Sources
Miscellaneous
