

Experience-dependent plasticity in S1 caused by noncoincident inputs
- PMID: 16105958
- PMCID: PMC2826984
- DOI: 10.1152/jn.00172.2005
Experience-dependent plasticity in S1 caused by noncoincident inputs
Abstract
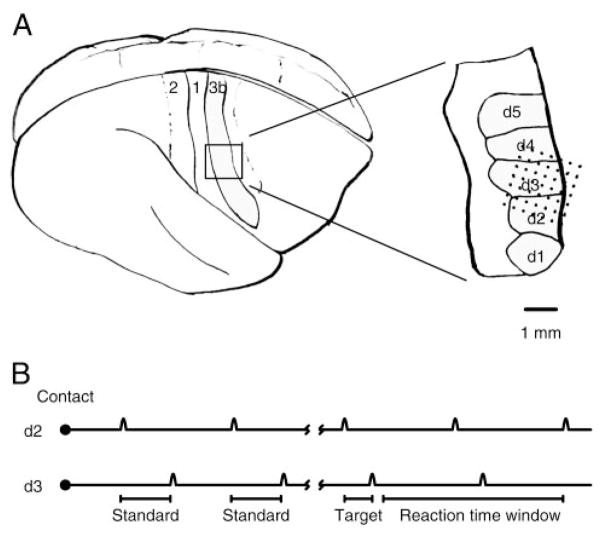
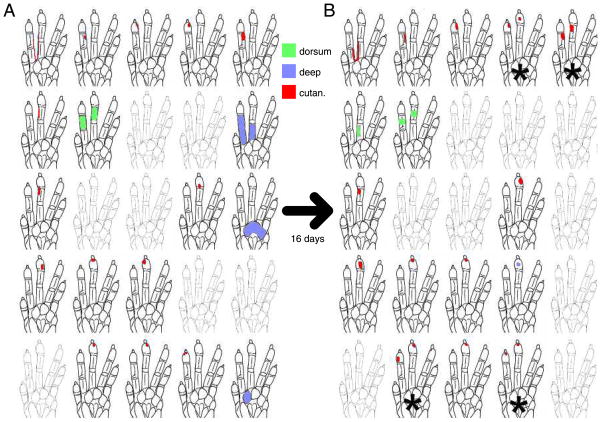
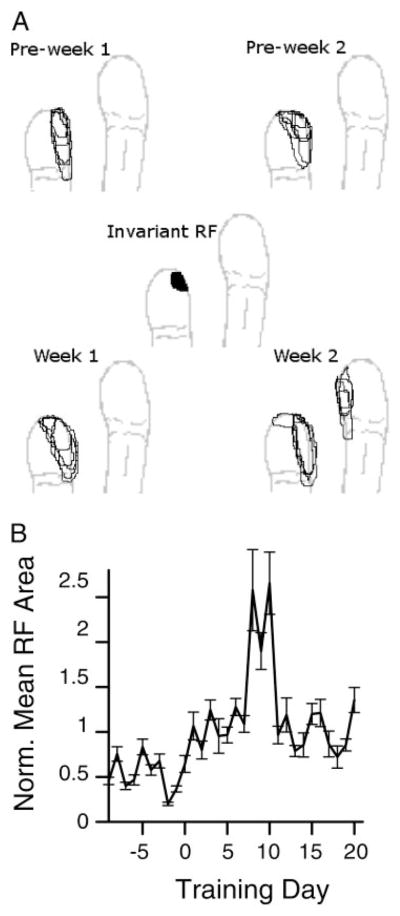
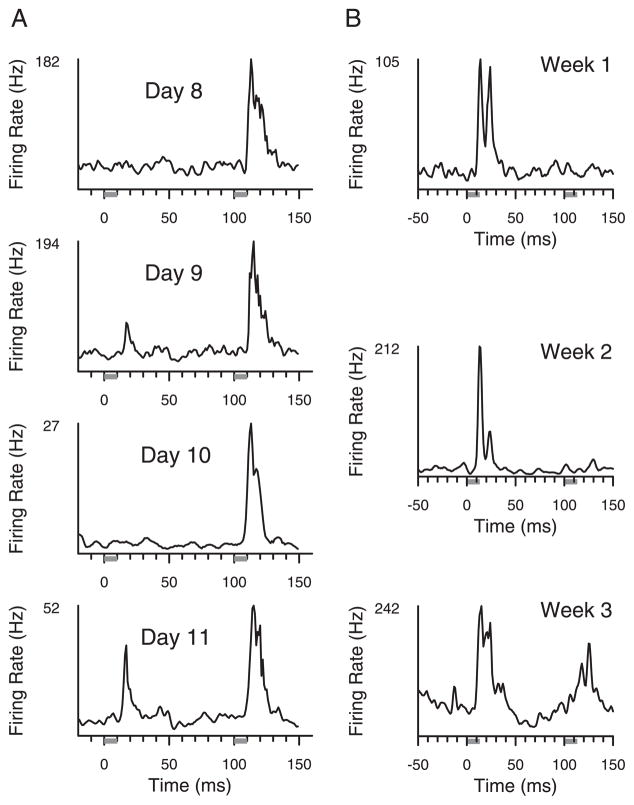
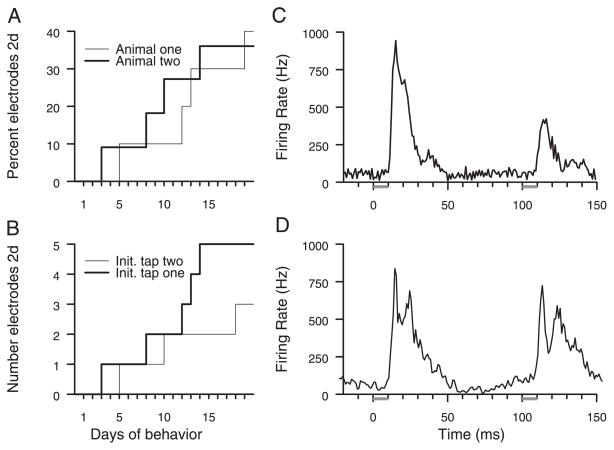
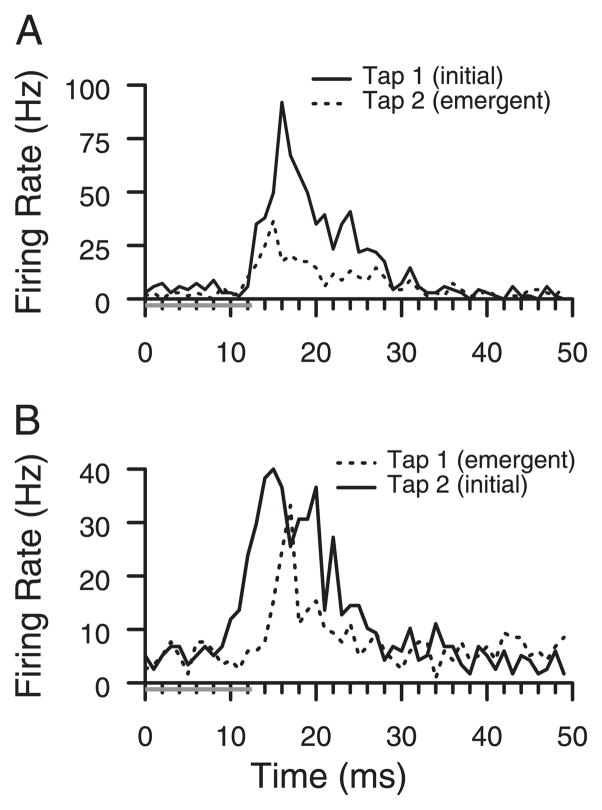
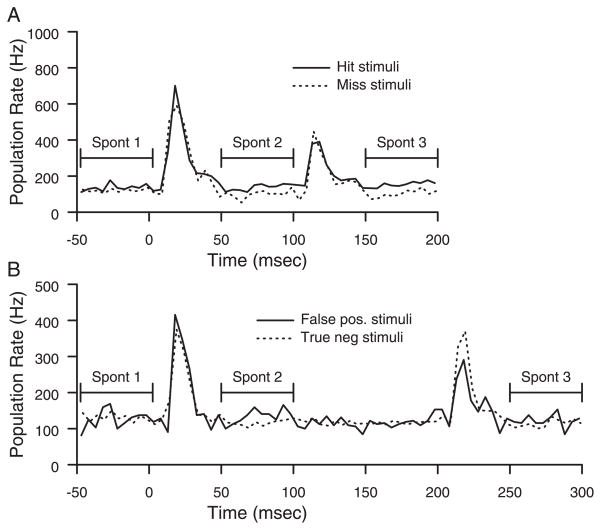
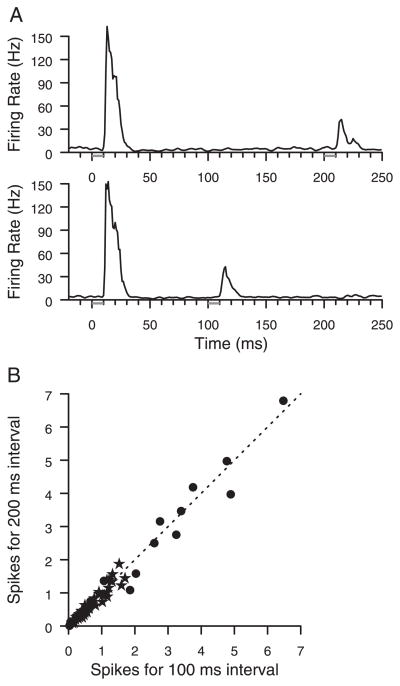
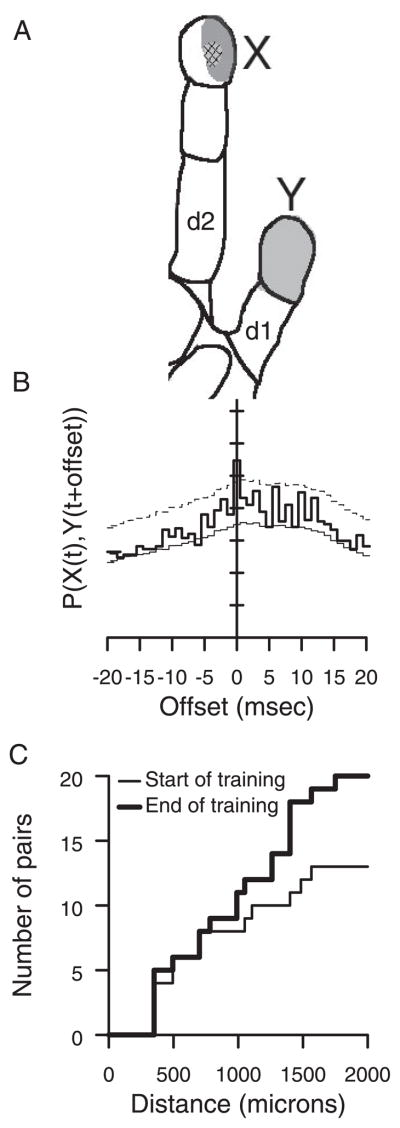
Prior work has shown that coincident inputs became co-represented in somatic sensory cortex. In this study, the hypothesis that the co-representation of digits required synchronous inputs was tested, and the daily development of two-digit receptive fields was observed with cortical implants. Two adult primates detected temporal differences in tap pairs delivered to two adjacent digits. With stimulus onset asynchronies of > or = 100 ms, representations changed to include two-digit receptive fields across the first 4 wk of training. In addition, receptive fields at sites responsive to the taps enlarged more than twofold, and receptive fields at sites not responsive to the taps had no significant areal change. Further training did not increase the expression of two-digit receptive fields. Cortical responses to the taps were not dependent on the interval length. Stimuli preceding a hit, miss, false positives, and true negatives differed in the ongoing cortical rate from 50 to 100 ms after the stimulus but did not differ in the initial, principal, response to the taps. Response latencies to the emergent responses averaged 4.3 ms longer than old responses, which occurs if plasticity is cortical in origin. New response correlations developed in parallel with the new receptive fields. These data show co-representation can be caused by presentation of stimuli across a longer time window than predicted by spike-timing-dependent plasticity and suggest that increased cortical excitability accompanies new task learning.
Figures
Similar articles
-
Topographic reorganization of the hand representation in cortical area 3b owl monkeys trained in a frequency-discrimination task.J Neurophysiol. 1992 May;67(5):1031-56. doi: 10.1152/jn.1992.67.5.1031. J Neurophysiol. 1992. PMID: 1597696
-
Experience-induced plasticity of cutaneous maps in the primary somatosensory cortex of adult monkeys and rats.J Physiol Paris. 1996;90(3-4):277-87. doi: 10.1016/s0928-4257(97)81438-6. J Physiol Paris. 1996. PMID: 9116682
-
Plasticity of primary somatosensory cortex paralleling sensorimotor skill recovery from stroke in adult monkeys.J Neurophysiol. 1998 Apr;79(4):2119-48. doi: 10.1152/jn.1998.79.4.2119. J Neurophysiol. 1998. PMID: 9535973
-
Visualizing Adult Cortical Plasticity Using Intrinsic Signal Optical Imaging.In: Frostig RD, editor. In Vivo Optical Imaging of Brain Function. 2nd edition. Boca Raton (FL): CRC Press/Taylor & Francis; 2009. Chapter 9. In: Frostig RD, editor. In Vivo Optical Imaging of Brain Function. 2nd edition. Boca Raton (FL): CRC Press/Taylor & Francis; 2009. Chapter 9. PMID: 26844321 Free Books & Documents. Review.
-
Multielectrode Recordings in the Somatosensory System.In: Nicolelis MAL, editor. Methods for Neural Ensemble Recordings. 2nd edition. Boca Raton (FL): CRC Press/Taylor & Francis; 2008. Chapter 6. In: Nicolelis MAL, editor. Methods for Neural Ensemble Recordings. 2nd edition. Boca Raton (FL): CRC Press/Taylor & Francis; 2008. Chapter 6. PMID: 21204443 Free Books & Documents. Review.
Cited by
-
The most sensitive inputs to cutaneous representing regions of primary somatosensory cortex do not change with behavioral training.Physiol Rep. 2015 Dec;3(12):e12623. doi: 10.14814/phy2.12623. Physiol Rep. 2015. PMID: 26634900 Free PMC article.
-
Experience-dependent adult cortical plasticity requires cognitive association between sensation and reward.Neuron. 2006 Oct 19;52(2):371-81. doi: 10.1016/j.neuron.2006.08.009. Neuron. 2006. PMID: 17046698 Free PMC article.
-
Functional consequences of experience-dependent plasticity on tactile perception following perceptual learning.Eur J Neurosci. 2016 Sep;44(6):2375-86. doi: 10.1111/ejn.13343. Epub 2016 Aug 1. Eur J Neurosci. 2016. PMID: 27422224 Free PMC article.
-
Theta-burst stimulation over primary somatosensory cortex modulates tactile acuity of tongue.bioRxiv [Preprint]. 2024 Jun 18:2024.06.17.599457. doi: 10.1101/2024.06.17.599457. bioRxiv. 2024. Update in: J Neurophysiol. 2025 May 1;133(5):1341-1349. doi: 10.1152/jn.00556.2024. PMID: 38948808 Free PMC article. Updated. Preprint.
-
Nursing-induced somatosensory cortex plasticity: temporally decoupled changes in neuronal receptive field properties are accompanied by modifications in activity-dependent protein expression.J Neurosci. 2006 Oct 18;26(42):10667-76. doi: 10.1523/JNEUROSCI.3253-06.2006. J Neurosci. 2006. PMID: 17050706 Free PMC article.
References
-
- Allard T, Clark SA, Jenkins WM, Merzenich MM. Reorganization of somatosensory area 3b representations in adult owl monkeys after digital syndactyly. J Neurophysiol. 1991;66:1048–1058. - PubMed
-
- Antonini A, Stryker M. Rapid remodeling of axonal arbors in the visual cortex. Science. 1993;260:1819–1821. - PubMed
Publication types
MeSH terms
Grants and funding
LinkOut - more resources
Full Text Sources
Miscellaneous