. 2005 Aug 16;33(14):4626-38.
doi: 10.1093/nar/gki775. Print 2005.

Ancestral paralogs and pseudoparalogs and their role in the emergence of the eukaryotic cell

Affiliations

Ancestral paralogs and pseudoparalogs and their role in the emergence of the eukaryotic cell

Kira S Makarova et al. Nucleic Acids Res. .

Abstract

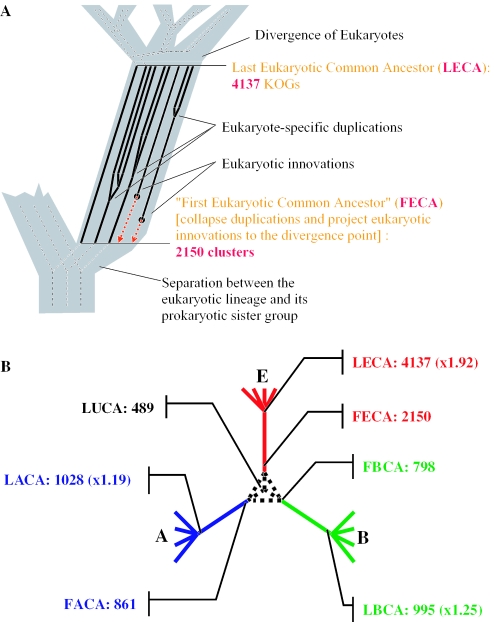
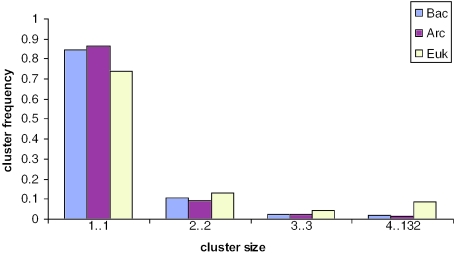
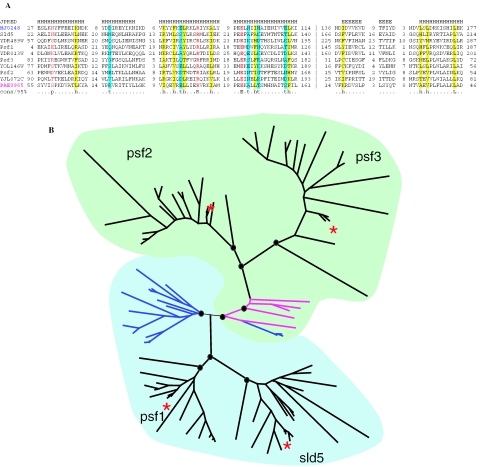
Gene duplication is a crucial mechanism of evolutionary innovation. A substantial fraction of eukaryotic genomes consists of paralogous gene families. We assess the extent of ancestral paralogy, which dates back to the last common ancestor of all eukaryotes, and examine the origins of the ancestral paralogs and their potential roles in the emergence of the eukaryotic cell complexity. A parsimonious reconstruction of ancestral gene repertoires shows that 4137 orthologous gene sets in the last eukaryotic common ancestor (LECA) map back to 2150 orthologous sets in the hypothetical first eukaryotic common ancestor (FECA) [paralogy quotient (PQ) of 1.92]. Analogous reconstructions show significantly lower levels of paralogy in prokaryotes, 1.19 for archaea and 1.25 for bacteria. The only functional class of eukaryotic proteins with a significant excess of paralogous clusters over the mean includes molecular chaperones and proteins with related functions. Almost all genes in this category underwent multiple duplications during early eukaryotic evolution. In structural terms, the most prominent sets of paralogs are superstructure-forming proteins with repetitive domains, such as WD-40 and TPR. In addition to the true ancestral paralogs which evolved via duplication at the onset of eukaryotic evolution, numerous pseudoparalogs were detected, i.e. homologous genes that apparently were acquired by early eukaryotes via different routes, including horizontal gene transfer (HGT) from diverse bacteria. The results of this study demonstrate a major increase in the level of gene paralogy as a hallmark of the early evolution of eukaryotes.


Figures

Figure 1
Figure 1
Last and ‘first’ common ancestors. (A) A scheme of the procedure used to derive the gene sets in the last and ‘first’ common ancestors of eukaryotes. (B) The gene sets of ‘first common ancestors’ of eukaryotes, archaea and bacteria derived from the gene repertoires of the respective last common ancestors and identification of ancestral duplications. Abbreviations: A, archaea; B, bacteria; E, eukaryotes; LECA, last eukaryotic common ancestor; FECA, first eukaryotic common ancestor; LACA, last archaeal common ancestor; FACA, first archaeal common ancestor; LBCA, last bacterial common ancestor; FBCA, first bacterial common ancestor; LUCA, last universal common ancestor.
Figure 2
Figure 2
Size distributions of ancestral paralogous clusters in eukaryotes, archaea and bacteria. Relative frequencies of clusters of different size are shown for the three divisions of life.
Figure 3
Figure 3
Phylogenetic trees of clusters of homologous KOGs illustrating ancestral eukaryotic duplications and pseudoparalogy. (A) A case of multiple ancestral duplications of a gene of archaeal origin. IMP4 domain-containing proteins. (B) A cluster with a mixed history of duplication of pseudoparalogy. Predicted GTPases. (C) A cluster of multiple pseudoparalogs. FAD/FMN-containing dehydrogenases. Eukaryotic branches are shown in red, archaeal branches are shown in blue, and bacterial branches are shown in black. Only the numbers of (pseudo)paralogous KOG, the numbers of the homologous COG (a single one for each tree) and, where relevant, major bacterial taxa are indicated. Trees with all species names indicated are given in the Supplementary Material. The maximum likelihood trees were constructed using ProtML program (52) to perform local rearrangements on the Neighbour-Joining tree as described previously (80). Nodes with RELL bootstrap support >70% are boldfaced.
Figure 4
Figure 4
Evolution of the GINS family. (A) Multiple alignment of the selected GINS proteins. Sequences are denoted by gene names: Sld5, Psf1, Psf3, Psf2—experimentally characterized GINS proteins from Xenopus laevis (70); YDR489W, YDR013W, YOL146W, YJL072C—orthologous proteins from S.cerevisiae (71); MJ0248—homolog from the euryarchaeon Methanocaldococcus jannaschii; PAE0965—homolog from the crenarchaeon Pyrobaculum aerophilum. The positions of the first and the last residue of the aligned region in the corresponding protein are indicated for each sequence. The numbers within the alignment represent poorly conserved inserts that are not shown. The vertical dashed line separates the permuted region. The colouring is based on the consensus (calculated for all sequences in the alignment) shown underneath the alignment; h/yellow indicates hydrophobic residues (ACFILMVWYHRK), t/cyan indicates turn-forming residues (ASTDNVGPERK), p/red indicates charged residues (STEDKRNQH), positions with identical amino acids are boldfaced. The secondary structure was predicted using the JPRED program (81). H indicates α-helix, E indicates extended conformation (β-strand). (B) Schematic representation of the phylogenetic tree of the GINS family. The representation is based on a maximum likelihood tree of 97 sequences of GINS family reconstructed using ProtML program. Nodes with bootstrap support >70% are marked by circles. Euryarchaeal branches are shown in blue, and the Crenarchaeal branches are shown in magenta. The two coloured areas denote the two permuted forms of the protein. Branches corresponding to the Sld5, Psf1, Psf3, Psf2 proteins from X.laevis are marked by red asterisks.

References

    1. Fisher R.A. The possible modification of the response of the wild type to recurrent mutations. Am. Nat. 1928;62:115–126.
    1. Haldane J.B.S. The part played by recurrent mutation in evolution. Am. Nat. 1933;67:5–19.
    1. Muller H.J. The origination of chromatin deficiencies as minute deletions subject to insertion elsewhere. Genetics. 1935;17:237–252.
    1. Bridges C.A. Salivary chromosome maps. J. Hered. 1935;26:60–64.
    1. Ohno S. Evolution by Gene Duplication. Berlin-Heidelberg-NY: Springer-Verlag; 1970.

Publication types