Comparative Study
. 2005 Aug 17;25(33):7517-28.
doi: 10.1523/JNEUROSCI.2010-05.2005.

The two isoforms of the Caenorhabditis elegans leukocyte-common antigen related receptor tyrosine phosphatase PTP-3 function independently in axon guidance and synapse formation

Affiliations
Comparative Study

The two isoforms of the Caenorhabditis elegans leukocyte-common antigen related receptor tyrosine phosphatase PTP-3 function independently in axon guidance and synapse formation

Brian D Ackley et al. J Neurosci. .

Abstract

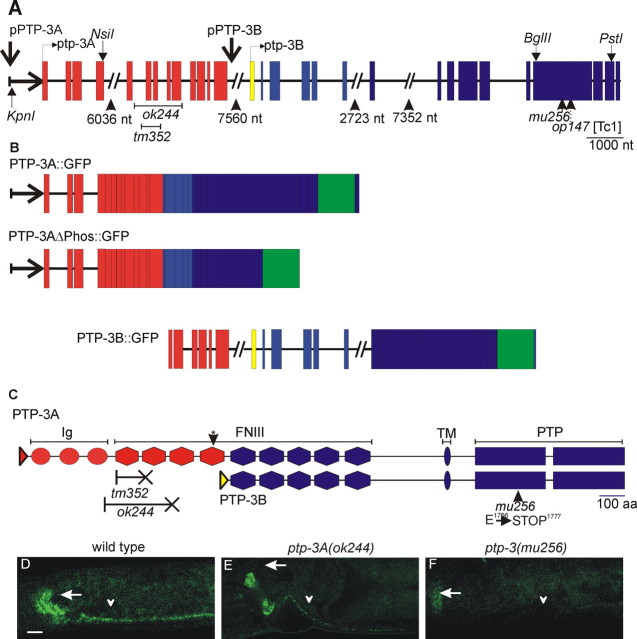
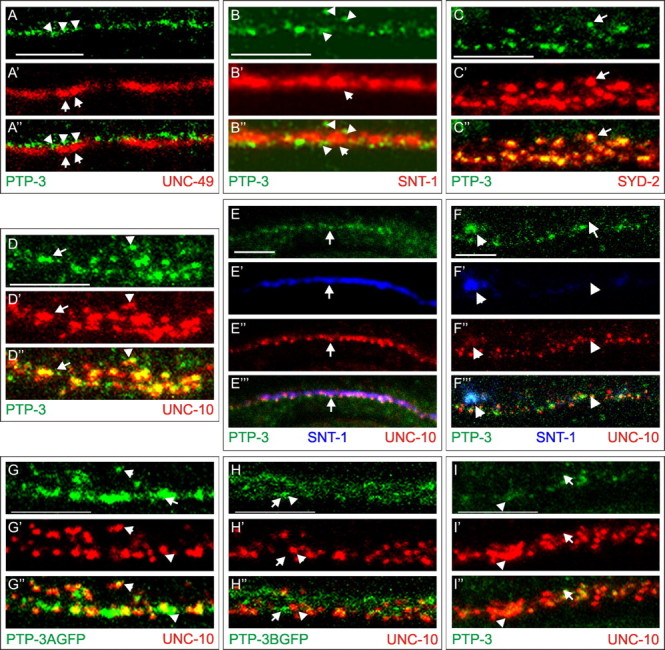
Leukocyte-common antigen related (LAR)-like phosphatase receptors are conserved cell adhesion molecules that function in multiple developmental processes. The Caenorhabditis elegans ptp-3 gene encodes two LAR family isoforms that differ in the extracellular domain. We show here that the long isoform, PTP-3A, localizes specifically at synapses and that the short isoform, PTP-3B, is extrasynaptic. Mutations in ptp-3 cause defects in axon guidance that can be rescued by PTP-3B but not by PTP-3A. Mutations that specifically affect ptp-3A do not affect axon guidance but instead cause alterations in synapse morphology. Genetic double-mutant analysis is consistent with ptp-3A acting with the extracellular matrix component nidogen, nid-1, and the intracellular adaptor alpha-liprin, syd-2. nid-1 and syd-2 are required for the recruitment and stability of PTP-3A at synapses, and mutations in ptp-3 or nid-1 result in aberrant localization of SYD-2. Overexpression of PTP-3A is able to bypass the requirement for nid-1 for the localization of SYD-2 and RIM. We propose that PTP-3A acts as a molecular link between the extracellular matrix and alpha-liprin during synaptogenesis.


Figures

Figure 1.
Figure 1.
The ptp-3 locus and protein localization. A, ptp-3 gene structure: exons are shown as shaded boxes, and introns are shown as lines. Large introns are indicated as broken lines with the size listed below. The genomic regions used to drive isoform-specific expression are indicated. The positions of restriction enzyme sites used to make minigenes and GFP fusions are also indicated. ptp-3A-specific exons are shown in red, whereas the ptp-3B-specific exon is shown in yellow. The exons common to ptp-3A and ptp-3B are in blue. The locations of the tm352, ok244, op147, and mu256 lesions are indicated. nt, Nucleotide. B, The gene structure of the PTP-3::GFP isoforms is illustrated. Exons are indicated by boxes, and introns are indicated as lines. The placement of the GFP coding sequences is indicated by the green box. C, PTP-3 proteins: Ig-like domains are illustrated as circles, FNIII domains are illustrated as hexagons, the predicted transmembrane domain is illustrated as an oval, and the phosphatase domains are illustrated as rectangles. The asterisk indicates the FNIII repeat most homologous to the FNIII repeat containing the laminin-nidogen-binding site from mouse LAR. The effects of the mutations are shown below. The X-headed line indicates the deleted portion of the protein and the introduction of a stop codon. D-F, Whole-mount immunolocalization of PTP-3 in wild-type (D), ptp-3(ok244) (E), and ptp-3(mu256) (F) animals. Staining is observed in the nerve ring (arrow) and ventral nerve cord (arrowhead) of wild-type and ptp-3(ok244) animals. All mu256 animals examined lacked reactivity in the nerve cord (F, arrowhead). Approximately 50% of ptp-3(mu256) animals exhibited weak PTP-3 staining in the nerve ring (F, arrow). Scale bar, 10 μm.
Figure 2.
Figure 2.
PTP-3A localizes to presynaptic regions. A-D, Costaining of PTP-3 (green) with proteins (red) that label different synaptic domains. The bottom panels are the merged images. A-A″, PTP-3 (arrowheads) does not overlap with UNC-49 (arrows). B-B″, PTP-3 (arrowheads) is concentrated at the edges of SNT-1 (arrows). C-C″, PTP-3 colocalizes with SYD-2. Note the smaller foci of PTP-3 at the center of the SYD-2 puncta (arrows). D-D″, Seventy-five percent of UNC-10 puncta are either overlapped (arrowheads) or coincident (arrows) with PTP-3. E, F, PTP-3 is trafficked to synapses independent of synaptic vesicles. A wild-type animal (E) and an unc-104 animal (F) are shown with triple labeling of anti-PTP-3 (green), anti-SNT-1 (blue), and anti-UNC-10 (red). The merged views are shown in the bottom panels. In unc-104 mutants, SNT-1 is mostly retained in cell bodies (arrow), whereas PTP-3 and UNC-10 are present along the nerve cord (arrowheads). G, H, The localization of the PTP-3 isoform-specific GFP fusion proteins is shown relative to UNC-10. G-G″, PTP-3A::GFP appeared punctate and overlapped with the UNC-10 puncta (arrows), although the protein was also observed in larger clusters than the endogenous protein (arrowheads). H-H″, PTP-3B::GFP showed diffused staining throughout the nerve cord (arrows) and rarely overlapped with UNC-10 puncta (arrowhead). I-I″, In ptp-3A(ok244) mutants, PTP-3 (arrowhead) staining is reduced, and showed little overlap with UNC-10 (arrows). Scale bars, 5 μm.
Figure 3.
Figure 3.
Mutations in ptp-3 cause defects in axon guidance. A, Schematic diagram describing the axon outgrowth patterns for the DA and DB cholinergic motor neurons. The cell bodies are illustrated as open circles, whereas the processes are indicated as black lines. The position of the vulva is indicated by a open diamond. The shaded box is the region shown in B and C. B, In wild-type animals, the DB6 and DB7 neurons (indicated by arrows) extend processes to the right, whereas the adjacent neurons, DA6 and DA7, extend processes to the left. C, In this ptp-3(mu256) animal, the DB6 and DB7 axons (arrows) incorrectly extend on the left side of the nerve cord. D, Region of the ventral nerve cord that has become defasciculated (arrow) from the main bundle (arrowheads). E, Two axons that failed to terminate at the end of the dorsal nerve cord (arrow) are observed to turn anteriorly and continue extending. F, Schematic diagram of the DD and VD GABAergic motor neurons. G, In wild-type animals, the dorsal nerve cord (arrows) is observed as a continuous bundle. H, In ptp-3 mutants, we observed gaps along the nerve cord where the axons appear to have terminated their migration prematurely. I, In wild-type animals, the commissural processes (arrows) extend from the ventral nerve cord to the dorsal cord (arrowheads). J, Two axon commissures failed to reach the dorsal nerve cord (arrowheads): one stopped migrating prematurely (arrow), whereas a second turned prematurely (dashed arrow). DA and DB (K) and DD and VD (L) axon guidance data are displayed as the percentage of animals that exhibited a side choice error (□), targeting error (formula image
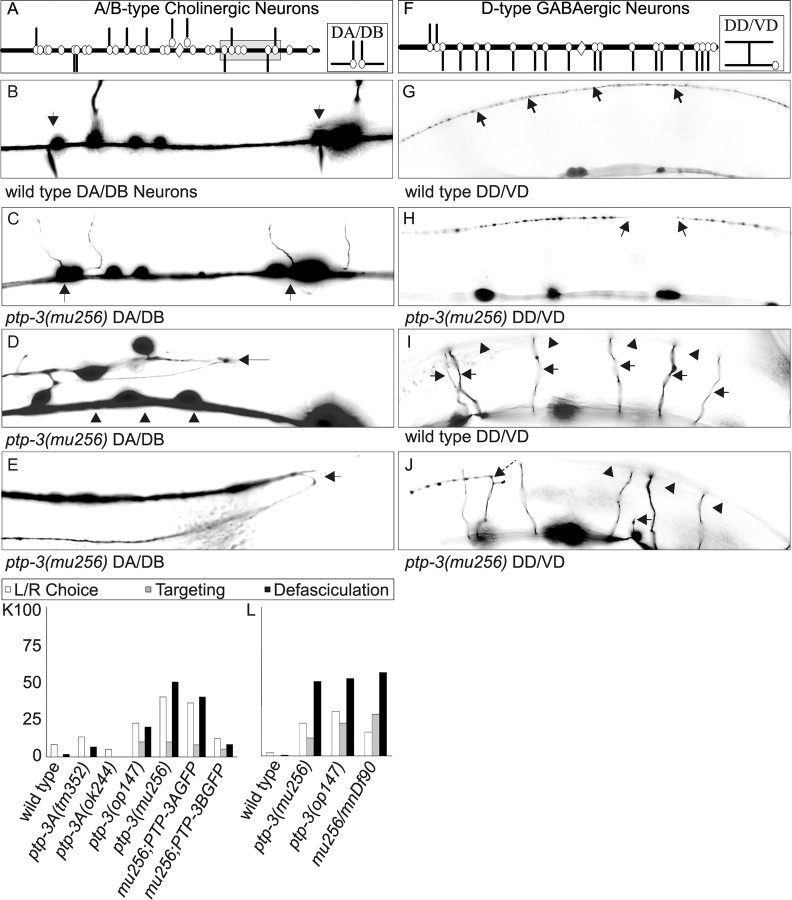
), or defasciculation (▪). Information on specific axon outgrowth phenotypes is in Table 2. L/R, Left/right.
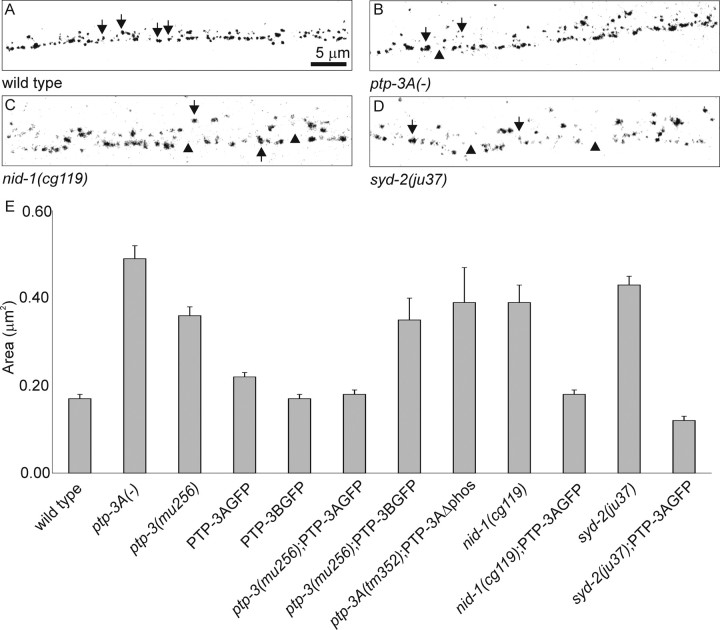
Figure 4.
Figure 4.
Expression of UNC-10 in mutants. A-D, UNC-10 puncta are indicated by arrows, whereas abnormally sized gaps are indicated by arrowheads. A, In wild-type animals, UNC-10 puncta were evenly sized and spaced along the nerve cords. B, In ptp-3, UNC-10 puncta appeared misshapen. In this ptp-3A mutant, we observed smaller and larger puncta that were aberrantly spaced. C, D, Similar defects were observed in nid-1(cg119) (C) and syd-2(ju37)(D) animals. E, Area of UNC-10 puncta in wild type and in ptp-3, nid-1, and syd-2 mutants, plotted as the mean ± SEM.
Figure 5.
Figure 5.
Pattern of SNB-1::GFP in GABAergic synapses in mutants. A, In wild-type animals, the SNB-1::GFP pattern was observed as equally sized and evenly spaced fluorescent puncta (arrow). B, In ptp-3A(tm352) mutants, SNB-1::GFP was present in larger, irregularly spaced puncta (arrows). C, In syd-2(ju37) mutants, SNB-1::GFP puncta were diffused and often appeared contiguous. D, SNB-1::GFP puncta in nid-1(cg119) mutants were elongated and aberrantly spaced. Cell bodies (arrowhead) were occasionally visible along the ventral nerve cord in all genotypes. E, The area of SNB-1::GFP puncta in the wild-type and various mutants, plotted as the mean ± SEM.
Figure 6.
Figure 6.
Boxplots of SNB-1::GFP quantitation. The area of all SNB-1::GFP measurements by genotype were represented as box plots. The box represents the values within the 25th to 50th percentiles, and the white bar (or gray arrowhead) indicates the mean observed value. The ends of the whiskers show the 10th to 90th percentiles, with the 5th and 95th percentiles indicated by black circles. The dotted lines illustrate the values that we set as limits to define puncta that are outliers from wild type as defined by the 10th (0.2 μm2) and 90th (1.5 μm2) percentile values. In wild type, the box and whiskers are compact, indicating the measurements fall into a reproducible pattern. The SNB-1::GFP puncta in mutants was more variable in size, resulting in larger plots. The shape of the box and whiskers is similar in the syd-2 single, double, and triple mutants demonstrating that these mutants are phenotypically similar in their effect on SNB-1::GFP accumulation. nid-1 single and nid-1;ptp-3A double mutants exhibit a similar distribution. In contrast, cle-1 single and cle-1;ptp-3A double mutants are phenotypically distinct.
Figure 7.
Figure 7.
NID-1 and SYD-2 have distinct effects in PTP-3 localization. The localization of PTP-3 (green) and UNC-10 (red) in nid-1(cg119), syd-2(ju37), and nid-1(cg119);syd-2(ju37) double mutants is shown. The boxed regions are magnified in the right panels. A, A′, PTP-3 and UNC-10 exhibited an overlapped pattern of accumulation in wild-type animals. B, B′, In nid-1 animals, PTP levels were reduced, but the pattern remained punctate. When present, PTP-3 coincided with UNC-10 puncta (arrowhead), whereas some UNC-10 puncta lacked PTP-3(arrow). C, C′, In syd-2 mutants, PTP-3 was diffuse and had a reduced coincidence with UNC-10 (arrowhead). PTP-3 and UNC-10 had accumulated independently (arrows), an event that was rarely seen in wild type (<25%). D, D′, In nid-1;syd-2 double mutants, PTP-3 detection was moderate but present in a more punctate pattern than syd-2 single mutants. However, PTP-3 and UNC-10 only rarely coincided (arrowhead); rather, each appeared to be exclusively punctate (arrows). Scale bar, 5 μm.
Figure 8.
Figure 8.
PTP-3 and NID-1 regulate SYD-2 accumulation. A, B, NID-1 localization in wild-type (A) and ptp-3A (B) animals is comparable. NID-1 (green) is localized in a continuous pattern at the interface of the ventral nerve cord fascicles and the muscles (arrowheads) and in a punctate pattern in the mantle of the mechanosensory neurons (arrows). C-H, SYD-2 (red) localization. C, In wild-type animals, SYD-2 was present along the nerve cords in a punctate pattern (arrowheads). D, syd-2(ju37) animals lacked staining (the position of the ventral nerve cord is indicated by arrowheads). E, F, In ptp-3 mutants, SYD-2 was observed in larger puncta (arrows) and also retained in cell bodies (arrowhead). G, In nid-1 animals, SYD-2 was diffuse, and the puncta (arrows) appeared enlarged. SYD-2 was also found in cell bodies (arrowheads). H, In nid-1 mutants expressing PTP-3A::GFP, SYD-2 expression is punctate (arrows), and the amount of SYD-2 in cell bodies is reduced (arrowheads). I, SYD-2::GFP expressed in the GABAergic neurons of wild-type animals appears punctate with the clusters being evenly sized and spaced (arrowheads). GFP is observed in the cell bodies in all genotypes (arrows; I-K). This effect is likely a result of overexpression and not the genetic background. J, ptp-3A(tm352) mutants exhibit an altered pattern of SYD-2::GFP accumulation, with larger clusters of GFP (arrowheads). K, nid-1(cg119) animals have enlarged SYD-2::GFP puncta (arrowheads) that are separated by large gaps. L, The mean area of SYD-2::GFP puncta was plotted by genotype. Scale bars, 10 μm.

Similar articles

Cited by

References

    1. Ackley BD, Crew JR, Elamaa H, Pihlajaniemi T, Kuo CJ, Kramer JM (2001) The NC1/endostatin domain of Caenorhabditis elegans type XVIII collagen affects cell migration and axon guidance. J Cell Biol 152: 1219-1232. - PMC - PubMed
    1. Ackley BD, Kang SH, Crew JR, Suh C, Jin Y, Kramer JM (2003) The basement membrane components nidogen and type XVIII collagen regulate organization of neuromuscular junctions in Caenorhabditis elegans J Neurosci 23: 3577-3587. - PMC - PubMed
    1. Altun-Gultekin Z, Andachi Y, Tsalik EL, Pilgrim D, Kohara Y, Hobert O (2001) A regulatory cascade of three homeobox genes, ceh-10, ttx-3 and ceh-23, controls cell fate specification of a defined interneuron class in C. elegans Development 128: 1951-1969. - PubMed
    1. Aricescu AR, McKinnell IW, Halfter W, Stoker AW (2002) Heparan sulfate proteoglycans are ligands for receptor protein tyrosine phosphatase sigma. Mol Cell Biol 22: 1881-1892. - PMC - PubMed
    1. Brenner S (1974) The genetics of Caenorhabditis elegans Genetics 77: 71-94. - PMC - PubMed

Publication types

MeSH terms

Substances