Comparative Study
. 2005 Aug 17;25(33):7538-47.
doi: 10.1523/JNEUROSCI.1927-05.2005.

High-concentration rapid transients of glutamate mediate neural-glial communication via ectopic release

Affiliations
Comparative Study

High-concentration rapid transients of glutamate mediate neural-glial communication via ectopic release

Ko Matsui et al. J Neurosci. .

Abstract

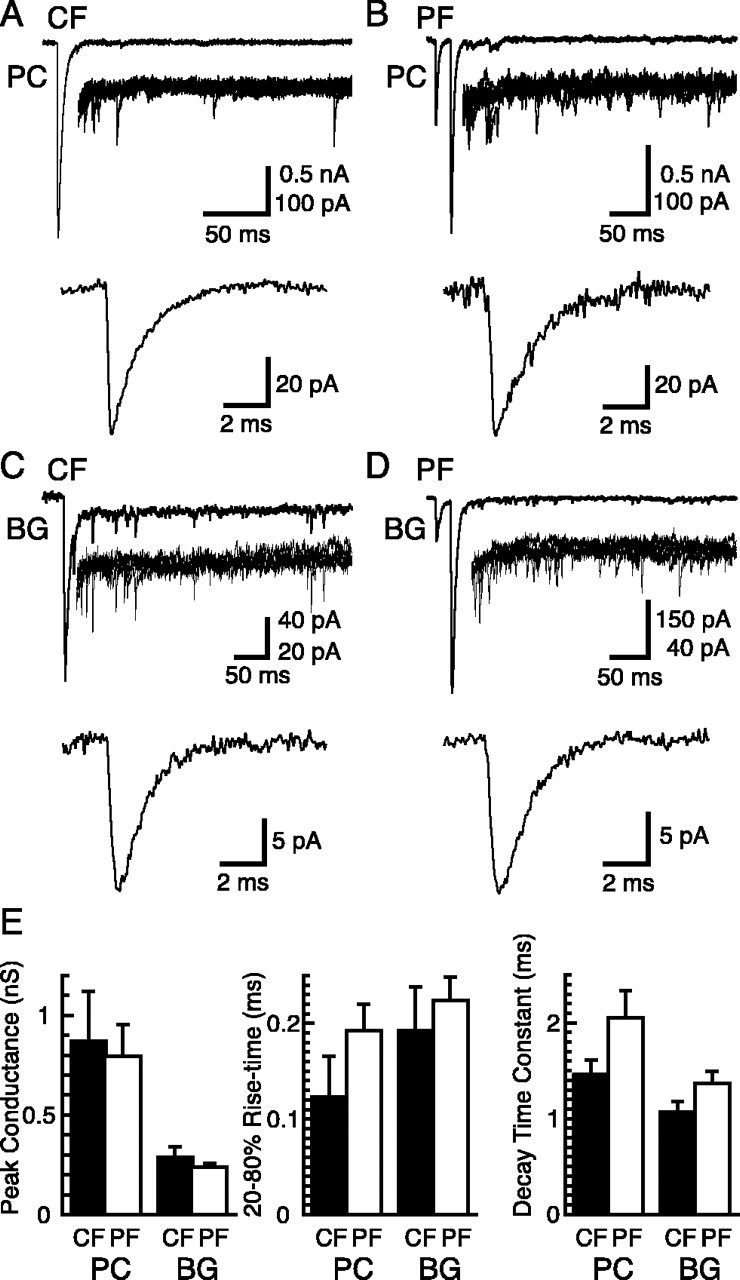
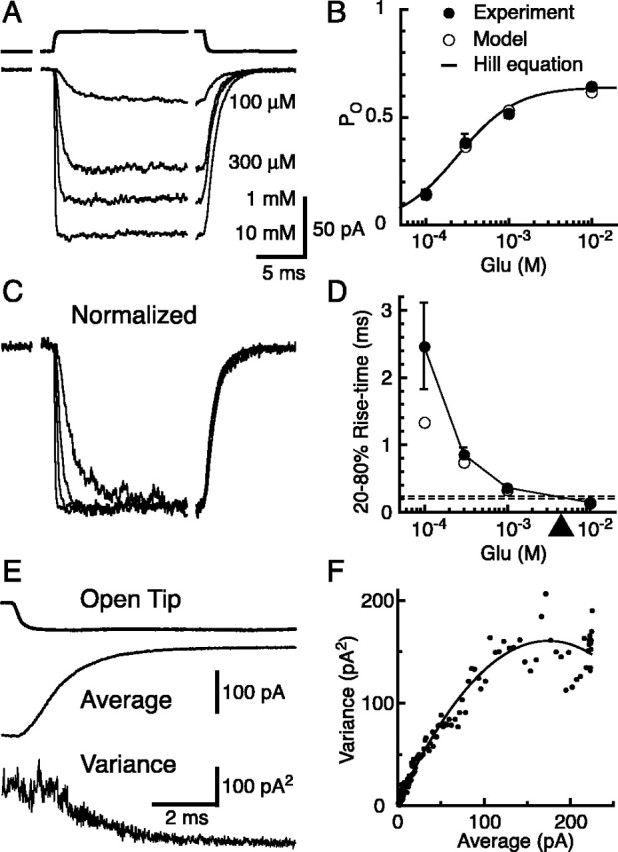
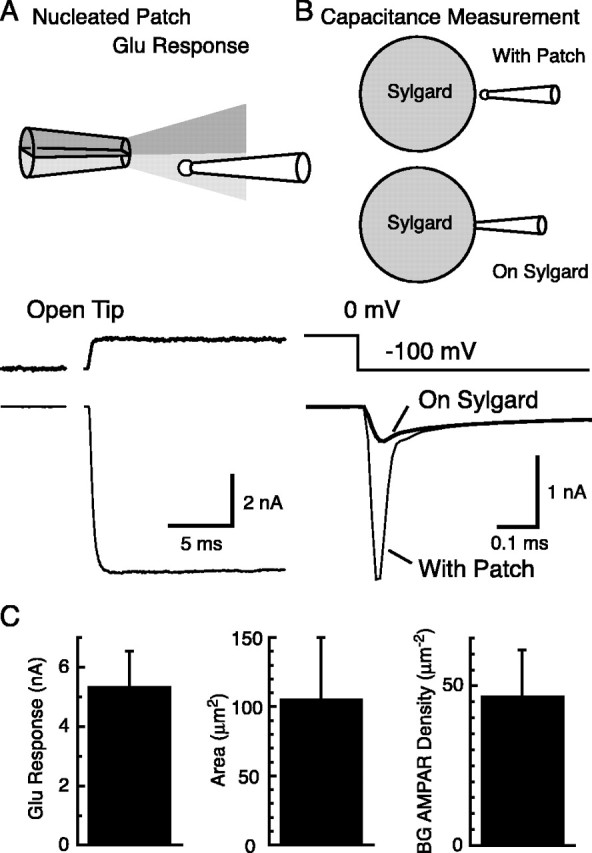
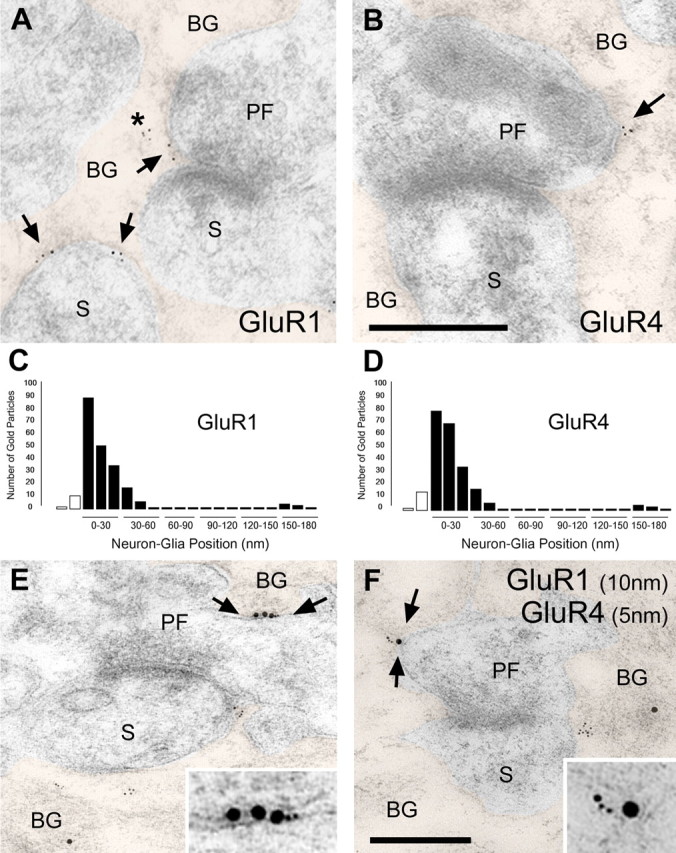
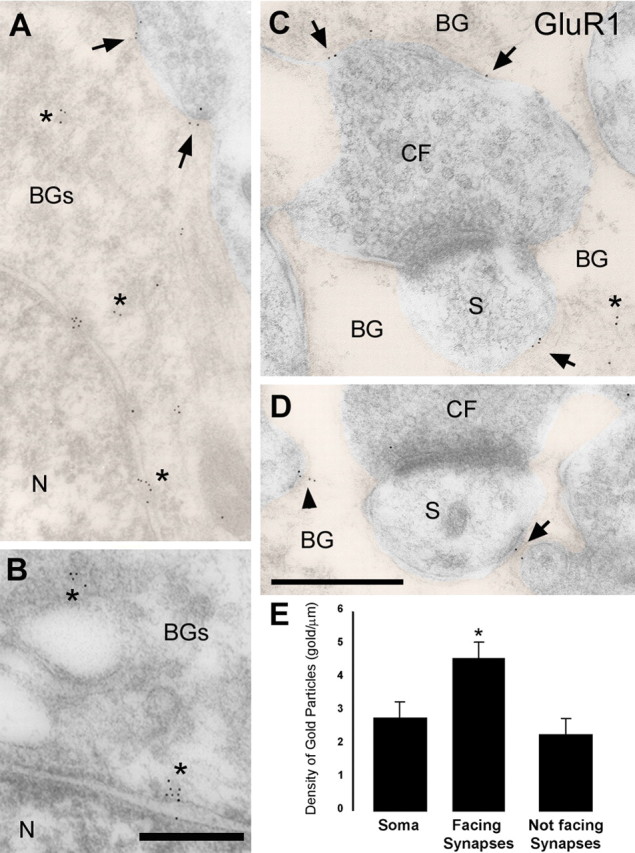
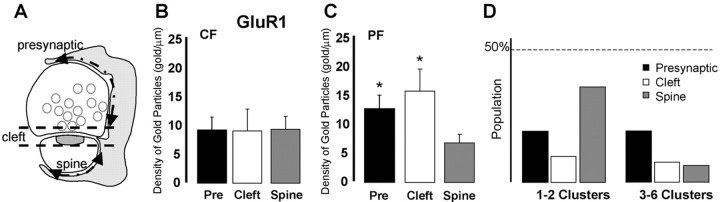
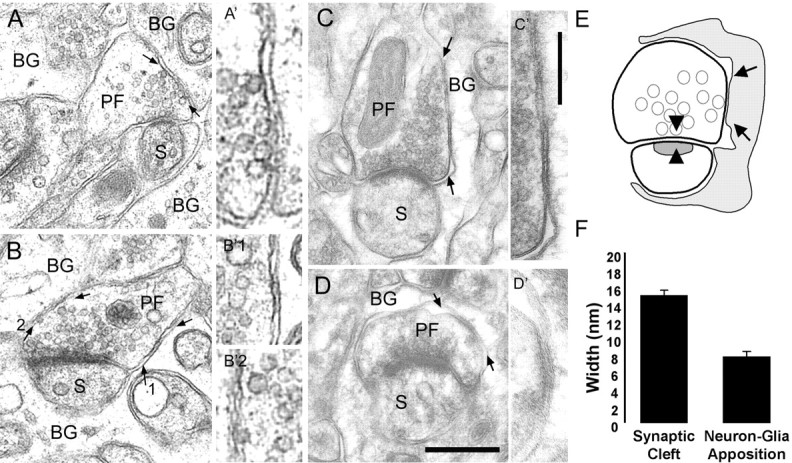
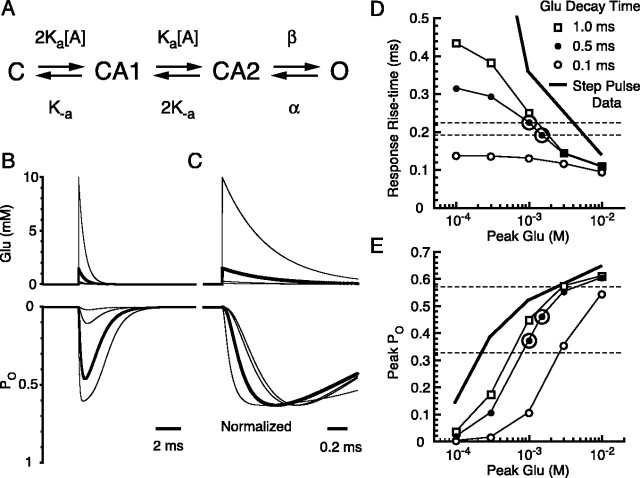
Until recently, communication from neurons to astrocytes was thought to be mediated by low-concentration transients of glutamate caused by spillover from the synaptic cleft. However, quantal events recorded in rat cerebellar Bergmann glial cells (BGs) have fast kinetics, comparable with those recorded in neurons. By combining outside-out patch recordings of BG AMPA receptors and quantitative electron microscopic analysis of glutamate receptor subunit 1 (GluR1) and GluR4 immunogold labeling measurements, at both the soma and membranes surrounding synapses, we estimate the absolute density of functional AMPA receptors. Using a kinetic model of BG AMPA receptors, we find that quantal events recorded in BGs are produced by high-concentration (approximately 1-1.5 mM), fast transients (approximately 0.5 ms decay) of glutamate, similar to transients within the synaptic cleft. Our results indicate that neural signaling to BGs is mediated by ectopic release of transmitter from presynaptic elements directly facing the BG membrane.


Figures

Figure 1.
Figure 1.
Kinetics of quantal events in Purkinje cells and Bergmann glial cells. A, CFs stimulated in the presence of 1.0 mm Sr2+/1.3 mm Mg2+ evoked asynchronously occurring quantal events in voltage-clamped PCs (Vh = -70 mV). Top trace, Example of a single epoch; middle traces, superimposition of the asynchronous events of five epochs at higher gain; bottom trace, average waveform of quantal responses collected from this cell. B, PC responses, as in A, after two PF stimuli (20 ms interval) in the presence of 2.0 mm Ca2+/1.3 mm Mg2+. C, BG responses to CF stimulation in the presence of 5 mm Sr2+ and 200 μm CTZ (Vh = -65 mV). D, BG responses to two PF stimuli (20 ms interval) in the presence of 2.0 mm Ca2+/1.3 mm Mg2+ and 200 μm CTZ. E, Summary of the peak conductance, the 20-80% rise time, and the decay time constant of quantal events recorded from PCs and BGs by stimulation of CFs and PFs (n = 5, 6, 4, and 7 cells for CF-PC, PF-PC, CF-BG, and PF-BG responses, respectively). Error bars represent SD.
Figure 2.
Figure 2.
AMPA receptor responses in outside-out patches from BGs. A, Responses of outside-out patches from BG soma to rapid application of 100 μm to 10 mm glutamate (bottom 4 traces). Top trace, Open tip junctional current indicating the time course of solution exchange. All patch recordings were done in the presence of 200 μm CTZ. Vh = -70 mV. B, Dose-response curve normalized by responses to 10 mm glutamate. Two or more concentrations of glutamate were tested in each patch, and the amplitudes were normalized to the response to 10 mm glutamate. Response amplitude at 10 mm glutamate was set to a PO of 0.64 as calculated by nonstationary noise analysis from separate set of patches as in E and F. Each filled circle is from eight or nine patches. The average data were fitted with the Hill equation (solid line; Vmax = 0.64; KD = 248 μm; n = 1.2). Open circles are from the kinetic model in Figure 8 A. C, Patch responses, shown in A, normalized to their peak amplitudes. D, Rise times (20-80%) of the patch responses versus glutamate concentration. Horizontal dashed lines represent the averages of the rise time of quanta recorded from CF (bottom) and PF (top) stimulations. The arrowhead indicates the approximate concentration of square pulses of glutamate needed to evoke patch currents with the same rise time. Filled circles, Data from 8-11 patches. Open circles are from the kinetic model in Figure 8 A. E, The decaying phase of the patch responses to 10 mm glutamate was used for the nonstationary noise analysis. Top trace, Open tip response; middle trace, average glutamate response; bottom trace, ensemble variance for 73 sweeps. F, The variance is plotted against the mean current from the same patch as in E. Each data point represents an average of five neighboring sampling points. A parabolic function (solid line) was fitted to the data and the single-channel conductance, the number of channels in the patch, and POmax was extracted (26.0 pS; 192 channels; POmax = 0.64 for this patch). Error bars represent SD.
Figure 3.
Figure 3.
Density of AMPA receptors at the cell soma of BGs. A, Nucleated outside-out patches were taken from the soma of BGs by applying slight negative pressure inside the pipette while pulling the pipette away from the cell soma. Rapid application of 10 mm glutamate in the presence of 200 μm CTZ (top trace, open tip junctional current) resulted in large AMPA receptor-mediated currents (bottom trace). Vh = -70 mV. B, The same nucleated outside-out patches used for recording glutamate responses were used for capacitance measurements. Voltage steps of -100 mV were applied, and the resulting current responses were recorded (thin line, with patch). After touching the surface of a Sylgard bead, the capacitive current attributable to the patch disappeared (thick line, on Sylgard). The difference between the two currents was taken. Step response of the recording system to the same voltage pulses were determined by recording the response of a resistor connected to the head-stage of the patch amplifier. This trace was fitted to the final level of the leakage component. Subtraction of this leakage component leaves the capacitive current across the membrane patch. The membrane charge induced by the voltage pulse is given by the integration of this capacitive current (90.7 fC for this patch). C, Left, Summary of glutamate response amplitudes from nucleated outside-out patches. Middle, Area of the membrane calculated from the capacitive charge. Right, BG AMPA receptor (AMPAR) density calculated by dividing glutamate response amplitude by the membrane potential, POmax, and single-channel current of BG AMPA receptors (n = 6 patches). Error bars represent SD.
Figure 4.
Figure 4.
Immunogold labeling for GluR1 and GluR4 is associated with BGs. A, Electron micrograph of a PF-PC synapse after postembedding immunogold labeling for GluR1. Gold particles are observed at the BG plasma membrane as well as intracellularly (asterisks). The arrows indicate gold particles at BG plasma membrane facing presynaptic endings (PF) or PC dendritic spines (S). BG profiles have been colorized. B, Electron micrographs after postembedding immunogold labeling for GluR4. Scale bar: (in B) A, B, 0.2 μm. C, Histogram showing the position of the GluR1 gold particles relative to neuron-glia apposition. Most of the gold particles for both AMPA receptor subunits are positioned from 0 (outer leaflet of BG plasma membrane) to 40 nm toward the BG cytoplasm. White bars represent the gold particles found in the presynaptic terminal and dendritic spine. D, Histogram showing the position of the GluR4 gold particles. E, F, GluR1 (10 nm particles) and GluR4 (5 nm particles) colocalize at the BG plasma membrane (arrows). Insets, Regions between arrows at higher magnification. Scale bar: (in F) E, F, 0.2 μm; insets, 0.1 μm.
Figure 5.
Figure 5.
Densities of gold particles labeling GluR1 on the BG plasma membrane. A, B, Electron micrographs of BG soma after postembedding immunogold labeling for GluR1. At the BG soma, gold particles for GluR1 are associated with the plasma membrane (arrows) and intracellularly (asterisks). N, Nucleus. BG profiles in A, C, and D have been colorized. C, D, At BG processes wrapping CF synapses (CF, presynaptic ending; S, PC dendritic spines), gold particles decorate the plasma membrane facing the synapses (arrows) and the plasma membrane “not facing synapses” (arrowheads), as well as intracellularly (asterisks). Scale bars: (in D) A, C, D, 0.2 μm; B, 0.1 μm. E, Histogram showing the density of gold particles for GluR1 at the BG plasma membrane of the soma, BG plasma membrane facing the synapse, and BG plasma membrane not facing the synapse. Note that the density of gold particles in not facing synapses is an upper limit, because there could be synapses in other sections. Density of gold particles in membranes facing synapses was statistically different from that in the soma (*p < 0.05) and from that in not facing synapses membranes (p < 0.001). Error bars represent SE.
Figure 6.
Figure 6.
Distribution of GluR1 labeling on BG processes surrounding CF and PF synapses. A, Schematic of a synapse surrounded by a BG process (gray). Arrows indicated the presynaptic and spine sections of the BG. The space between the dashed lines represents the synaptic cleft section of the BG process apposed to presynaptic and spine plasma membrane. Gold particles assigned to the “Cleft” category were, on average, 84 nm from the “T” intersection of the apposition between the presynaptic and postsynaptic membranes. Particles in the “Pre” category are those found along the rest of the apposition of the presynaptic bouton, whereas those in the “Spine” category are those apposing the spine up to the spine neck. B, C, Histograms show the density of gold particles for GluR1 at these three membrane sections surrounding CF and PF synapses. Pre, Presynaptic. *p<0.05. D, Histograms show the distribution of clusters of one or two and three to six gold particles labeling GluR1 on the BG membrane at the presynaptic, cleft, and spine membrane sections. The percentage of the two groups was related to the total population of gold particles (n = 215 gold particles). Error bars represent SE.
Figure 7.
Figure 7.
Close apposition between the BG and PF bouton plasma membranes. A, B, Electron micrographs showing immersion-fixed, epon-embedded cerebellum. A, Synaptic vesicles docked to the presynaptic membrane specialization and to the PF membrane facing the BG membrane (arrows). A′, Magnification of membrane apposition in A, indicated by arrows. B, Close apposition of PF and BG plasma membranes containing extracellular electron-dense material (arrows). B1, B2, Magnified areas of B, indicated by arrows. C, D, Lowicryl-embedded cerebellum after freeze substitution. Arrows indicate PF-BG close membrane appositions with electron-dense extracellular material. C, Synaptic vesicles are docked to the presynaptic specialization and close to the presynaptic membrane facing the BG. C-D′, Insets, A higher magnification of the area between arrows. Scale bars: (in D) A-D, 0.2 μm; (in C′) A-D′, 0.1 μm. E, Schematic drawing shows a PF-PC synapse surrounded by BG processes (gray). Arrowheads indicate the presynaptic and postsynaptic specialization (cleft), and arrows represent the closest apposition of the BG and PF plasma membrane. F, Histogram of the distance between the presynaptic and postsynaptic membrane (synaptic cleft) and between BG and neuronal (presynaptic ending and dendritic spine) plasma membranes. S, PC dendritic spines. Error bars represent SE.
Figure 8.
Figure 8.
Simulation of AMPA receptor kinetics. A, Kinetic scheme of the AMPA receptor model used to fit AMPA receptor currents in outside-out patches. Two equal binding sites for glutamate are assumed. Four parameters were manually iterated to fit the PO and the kinetics of glutamate response in conventional outside-out patches as in Figure 2. Rates used were as follows (units are per molar per second for Ka or per second for the rest): Ka = 7.5 × 10⁶, K-a = 1.6 × 10³, β = 8.2 × 10³, and α = 4.9 × 10³. B, The model was driven with glutamate transients with an instant rise and single exponential decay with a time constant of 0.5 ms and variable peak amplitude (top). The resulting simulated response is shown below. Thick traces show glutamate transient with peak of 1.5 mm and the simulated response. C, The same traces as in B, with simulated responses normalized to their peak amplitudes and shown in an expanded time scale. D, Rise time (20-80%) of the simulated AMPA receptor responses versus peak glutamate concentration with various decay time constants of the glutamate transient (as indicated). The thick line indicates the average rise time of patches to step increases of glutamate (from Fig. 2 D). Two horizontal dashed lines indicate the average rise times of the quanta recorded by CF (bottom) or PF (top) stimulation. E, Peak PO of the simulated AMPA receptor response versus peak glutamate concentration. The thick line indicates the PO of patch responses to step increases of glutamate (from Fig. 2 B). Horizontal lines indicate the range of PO estimated in the text. Symbols are the same as in D. Large open circles in D and E indicate optimum points (peak glutamate concentration, 1-1.5 mm; decay time, 0.5 ms) that satisfy both the kinetic and POpeak requirements.

References

    1. Altman J, Bayer SA (1997) Development of cerebellar system in relation to its evolution, structure and functions. New York: CRC.
    1. Araque A, Carmignoto G, Haydon PG (2001) Dynamic signaling between astrocytes and neurons. Annu Rev Physiol 63: 795-813. - PubMed
    1. Atluri PP, Regehr WG (1998) Delayed release of neurotransmitter from cerebellar granule cells. J Neurosci 18: 8214-8227. - PMC - PubMed
    1. Barbour B (2001) An evaluation of synapse independence. J Neurosci 21: 7969-7984. - PMC - PubMed
    1. Bergles DE, Dzubay JA, Jahr CE (1997) Glutamate transporter currents in Bergmann glial cells follow the time course of extrasynaptic glutamate. Proc Natl Acad Sci USA 94: 14821-14825. - PMC - PubMed

Publication types

LinkOut - more resources