Comparative Study
. 2005 Aug 17;25(33):7575-85.
doi: 10.1523/JNEUROSCI.0915-05.2005.

Limited segregation of different types of sound localization information among classes of units in the inferior colliculus

Affiliations
Comparative Study

Limited segregation of different types of sound localization information among classes of units in the inferior colliculus

Steven M Chase et al. J Neurosci. .

Abstract

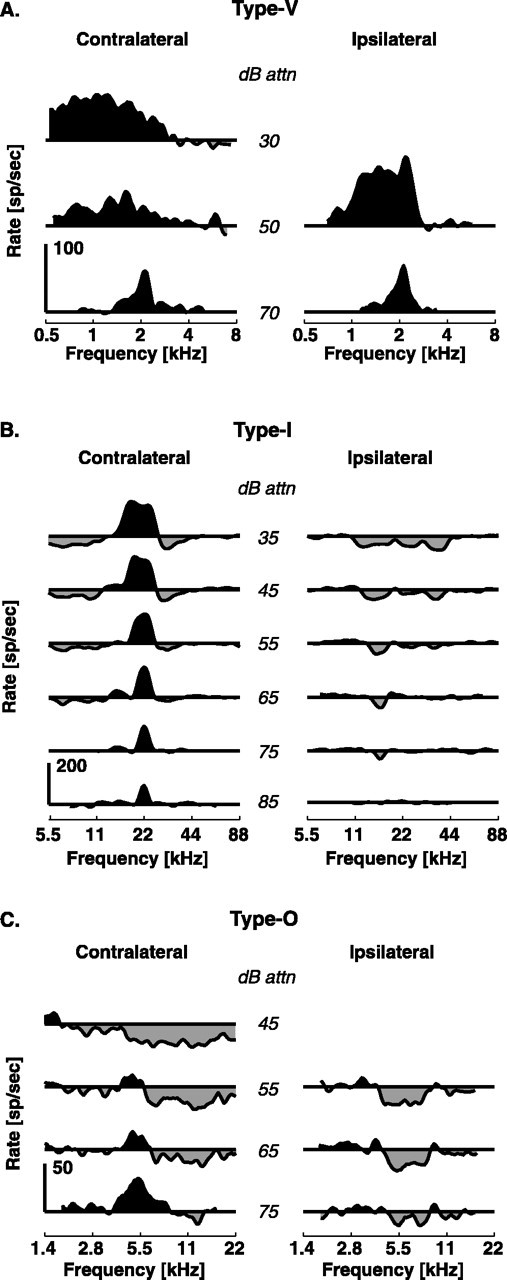
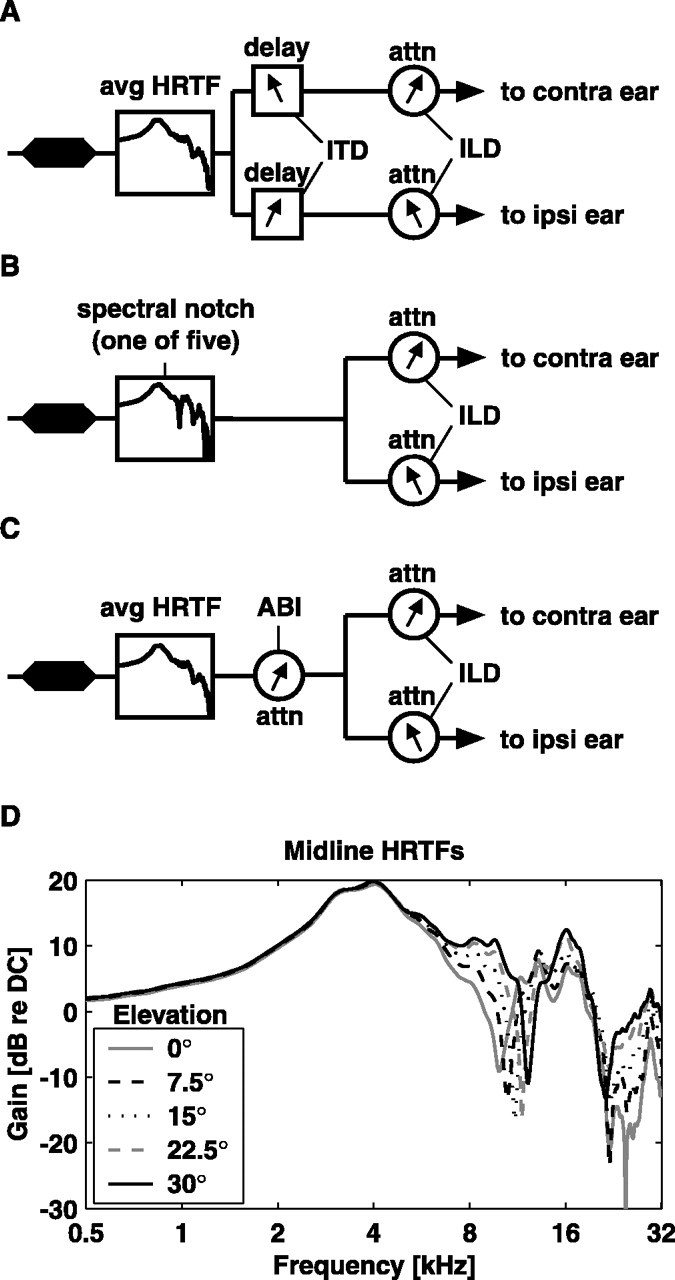
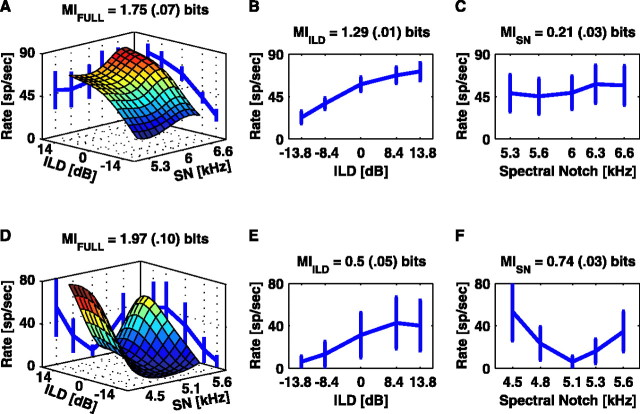
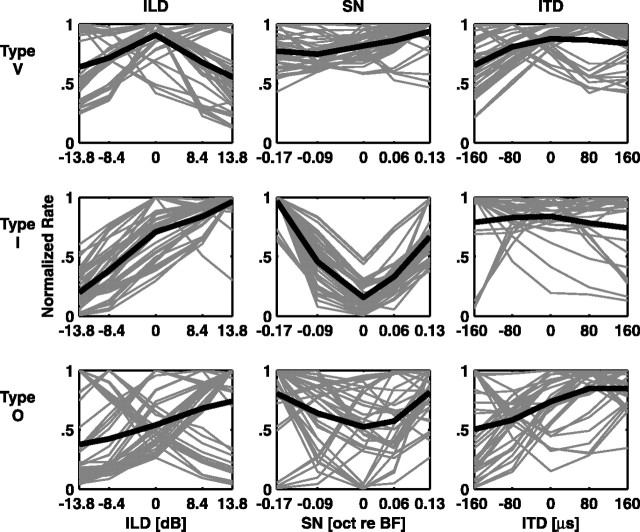
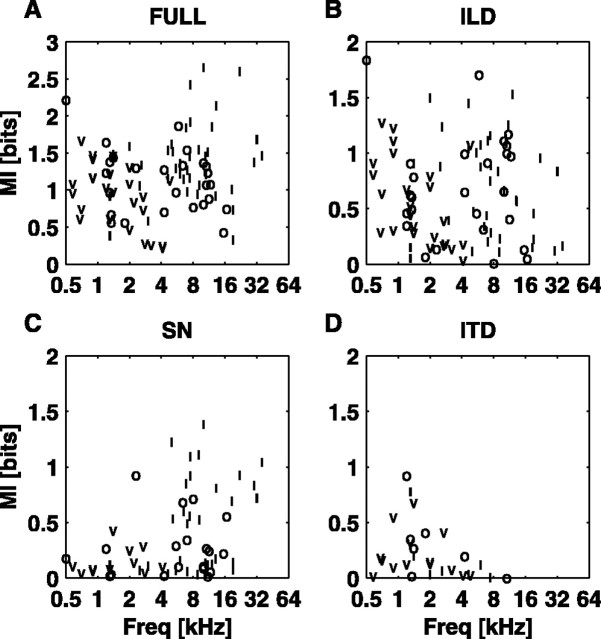
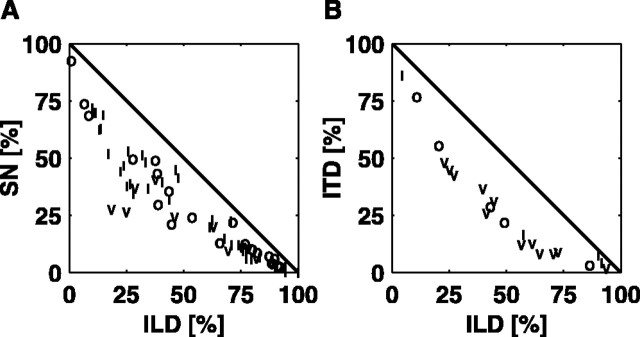
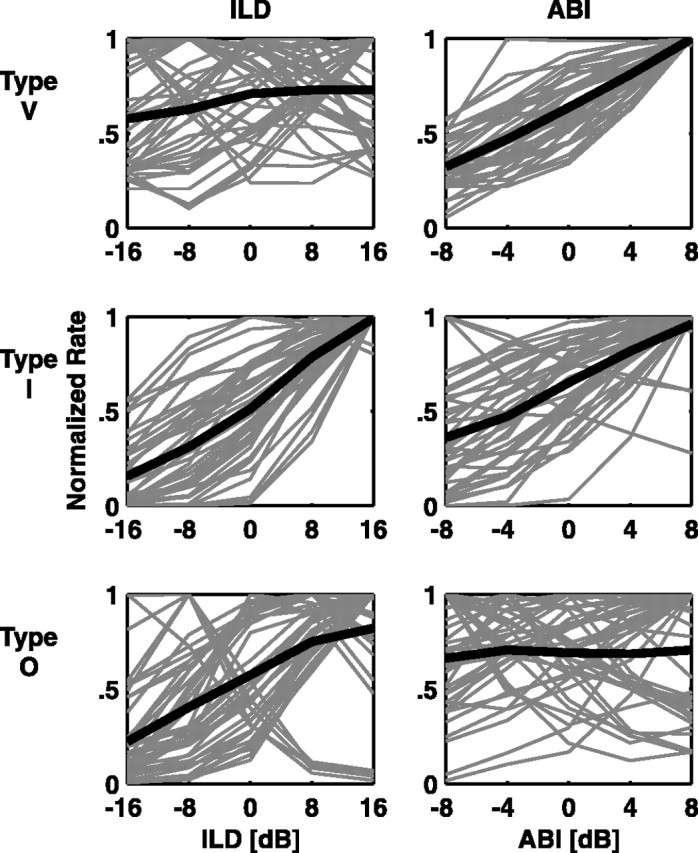
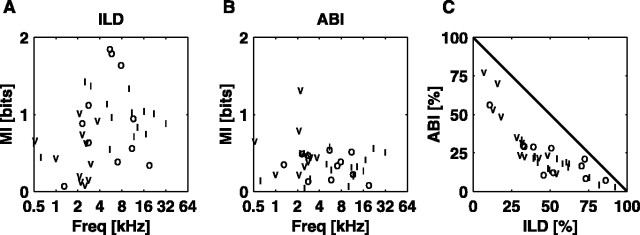
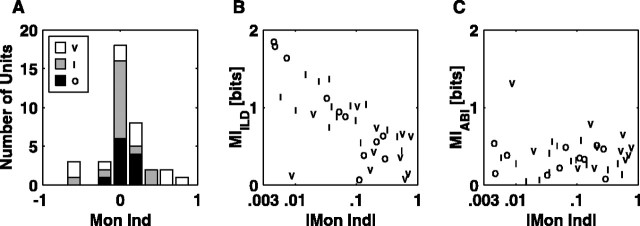
The auditory system uses three cues to decode sound location: interaural time differences (ITDs), interaural level differences (ILDs), and spectral notches (SNs). Initial processing of these cues is done in separate brainstem nuclei, with ITDs in the medial superior olive, ILDs in the lateral superior olive, and SNs in the dorsal cochlear nucleus. This work addresses the nature of the convergence of localization information in the central nucleus of the inferior colliculus (ICC). Ramachandran et al. (1999) argued that ICC neurons of types V, I, and O, respectively, receive their predominant inputs from ITD-, ILD-, and SN-sensitive brainstem nuclei, suggesting that these ICC response types should be differentially sensitive to localization cues. Here, single-unit responses to simultaneous manipulation of pairs of localization cues were recorded, and the mutual information between discharge rate and individual cues was quantified. Although rate responses to cue variation were generally consistent with those expected from the hypothesized anatomical connections, the differences in information were not as large as expected. Type I units provide the most information, especially about SNs in the physiologically useful range. Type I and O units provide information about ILDs, even at low frequencies at which actual ILDs are very small. ITD information is provided by a subset of all low-frequency neurons. Type V neurons provide information mainly about ITDs and the average binaural intensity. These results are the first to quantify the relative representation of cues in terms of information and suggest a variety of degrees of cue integration in the ICC.


Figures

Figure 1.
Figure 1.
Response maps typical of the classes of ICC units exhibiting sustained responses to tones. Driven rates are calculated over a 200 ms tone duration, and spontaneous rates are subtracted to reveal inhibition. At 0 dB attenuation (attn), the sound level is ∼100 dB sound pressure level. A, Type V unit, characterized by EE responses and little to no inhibition. B, Type I unit, characterized by EI responses and sideband inhibition. C, Type O unit, characterized by an island of excitation at low levels of contralateral stimulation turning to inhibition at higher levels. Responses to ipsilateral tones are typically inhibitory.
Figure 2.
Figure 2.
Stimulus construction. A, ITD/ILD stimulus set. Frozen noise was filtered through a cat HRTF, averaged over spatial location to give the location-independent spectral characteristics of the pinnae and ear canal. The noise was then copied into two streams, on which an ITD and an ILD were placed. B, SN/ILD stimulus set. The frozen noise was filtered through one of five HRTFs showing a prominent SN, split into two streams and attenuated relative to one another. C, ABI/ILD stimulus set. As in A, the frozen noise was filtered through the spatially averaged HRTF. It was then attenuated to one of five levels before being split into two streams that are attenuated relative to one another. The ILD was imposed such that the ABI was preserved. D, The five HRTFs used in the SN/ILD stimulus set. All were taken from the midline, at 0° azimuth. Note the prominent first SN, which shifts to higher frequencies as the elevation is increased. The SN/ILD stimulus set was resampled before presentation such that the notch for 15° elevation fell on the BF. avg, Average; attn, attenuation; contra, contralateral; ipsi, ipsilateral; DC, zero frequency.
Figure 3.
Figure 3.
Extracting the MI to the full stimulus set and to the individual location cues. A, The surface shows the mean response rate as a function of the ILD and SN (surface-smoothed with cubic spline interpolation). Contours on the vertical walls of the plot show the mean (±1 SD) of the rate as a function of ILD or SN only. The debiased MI is given above the plot with the bias estimate in parentheses. B, Mean rate versus ILD. C, Mean rate versus SN. D-F, Same for another unit showing more SN sensitivity. sp, Spikes.
Figure 4.
Figure 4.
Rate profiles of responses to the SN/ILD and ITD/ILD stimulus sets. Each profile has been normalized to its maximum response. Thin gray lines represent individual rate profiles, and thick black lines represent the means of all rate profiles in each category. oct, Octave.
Figure 5.
Figure 5.
MI plotted against the BF for the SN/ILD and ITD/ILD stimulus sets. SN/ILD stimuli are not differentiated from ITD/ILD stimuli, as the two groups overlap. A, MIFULL. B, MIILD. C, MISN. D, MIITD. Freq, Frequency.
Figure 6.
Figure 6.
The proportion of MIFULL used in coding individual cues. A, MISN is plotted against MIILD for all units studied with the SN/ILD stimulus set, both expressed as a fraction of MIFULL. B, Same for MIITD versus MIILD. Only units with BFs <4 kHz are plotted in B.
Figure 7.
Figure 7.
Normalized rate profiles of responses to the ABI/ILD stimulus set. Plotting conventions are the same as for Figure 4.
Figure 8.
Figure 8.
The differential coding of the average level and level difference information. A, MIILD versus BF for the ABI/ILD stimulus set. B, MIABI versus BF. C, MIABI plotted against MIILD for each unit, expressed as a percentage of MIFULL. Freq, Frequency.
Figure 9.
Figure 9.
Binaural sensitivity and coding. A, Histogram of monaural indices broken down by unit type. Values near 0 are the most binaural. Type O units cluster near 0, whereas type V units are more broadly distributed. B, MIILD is plotted against the absolute value of the monaural index, shown on a log scale. C, MIABI versus the monaural index. Mon Ind, Monaural index.

References

    1. Adams JC (1979) Ascending projections to the inferior colliculus. J Comp Neurol 183: 519-538. - PubMed
    1. Aitkin LM, Martin RL (1987) Neurons in the inferior colliculus of cats sensitive to sound-source elevation. Hear Res 50: 97-105. - PubMed
    1. Aitkin LM, Martin RL (1990) The representation of stimulus azimuth by high best-frequency azimuth-selective neurons in the central nucleus of the inferior colliculus of the cat. J Neurophysiol 57: 1185-1200. - PubMed
    1. Aitkin LM, Anderson DJ, Brugge JF (1970) Tonotopic organization and discharge characteristics of single neurons in nuclei of the lateral lemniscus in cat. J Neurophysiol 33: 421-440. - PubMed
    1. Aitkin LM, Webster WR, Veale JL, Crosby DC (1975) Inferior colliculus. I. Comparison of response properties of neurons in central, pericentral, and external nuclei of adult cat. J Neurophysiol 38: 1196-1207. - PubMed

Publication types