. 2005 Sep;25(17):7505-21.
doi: 10.1128/MCB.25.17.7505-7521.2005.

Mammalian peptidylglycine alpha-amidating monooxygenase mRNA expression can be modulated by the La autoantigen

Affiliations

Mammalian peptidylglycine alpha-amidating monooxygenase mRNA expression can be modulated by the La autoantigen

Fabienne Brenet et al. Mol Cell Biol. 2005 Sep.

Abstract

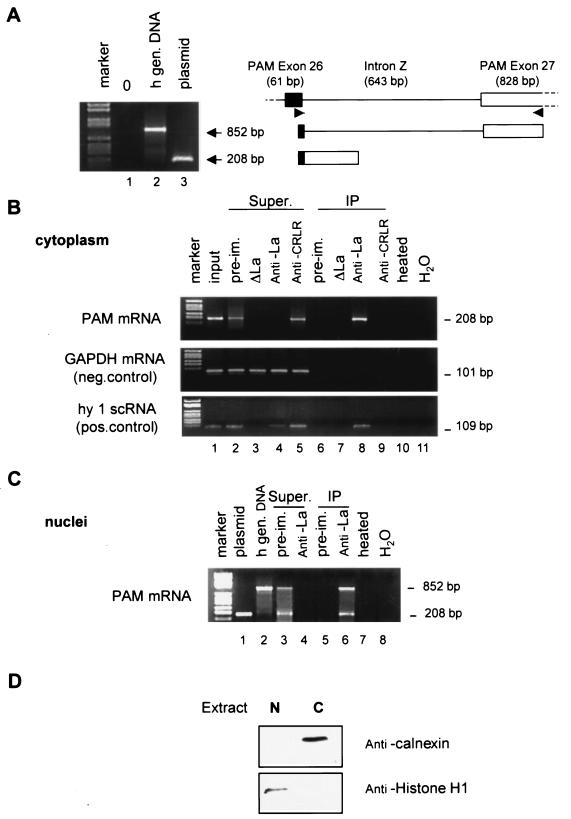
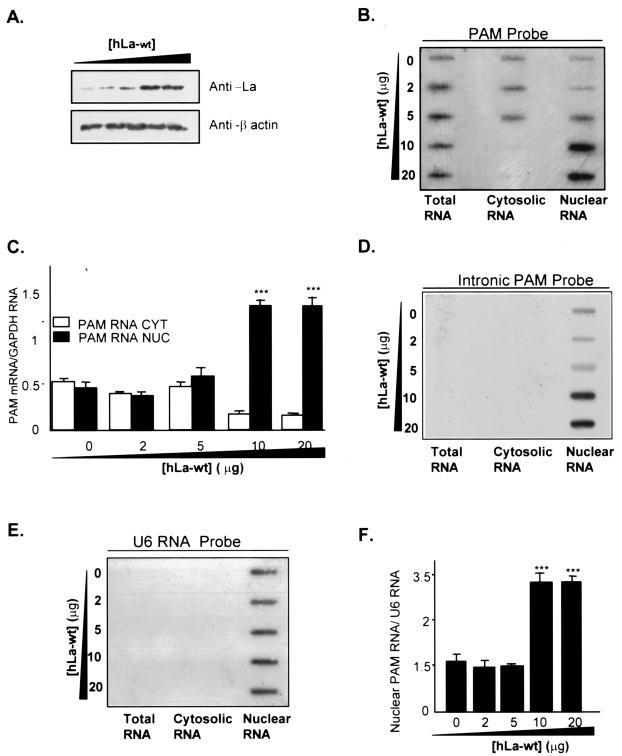
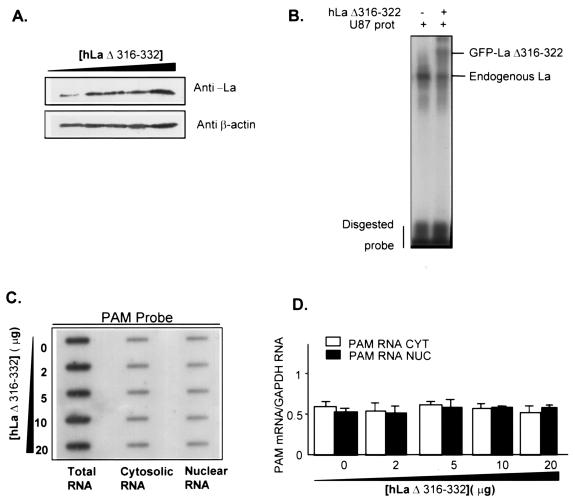
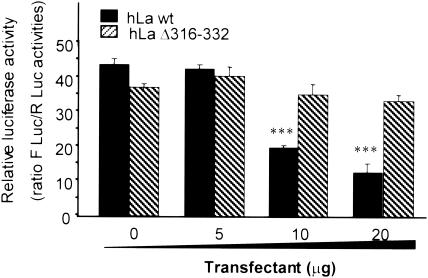
Peptidylglycine alpha-amidating monooxygenase (PAM; EC 1.14.17.3) catalyzes the COOH-terminal alpha-amidation of peptidylglycine substrates, yielding amidated products. We have previously reported a putative regulatory RNA binding protein (PAM mRNA-BP) that binds specifically to the 3' untranslated region (UTR) of PAM-mRNA. Here, the PAM mRNA-BP was isolated and revealed to be La protein using affinity purification onto a 3' UTR PAM RNA, followed by tandem mass spectrometry identification. We determined that the core binding sequence is approximately 15-nucleotides (nt) long and is located 471 nt downstream of the stop codon. Moreover, we identified the La autoantigen as a protein that specifically binds the 3' UTR of PAM mRNA in vivo and in vitro. Furthermore, La protein overexpression caused a nuclear retention of PAM mRNAs and resulted in the down-regulation of endogenous PAM activity. Most interestingly, the nuclear retention of PAM mRNA is lost upon expressing the La proteins that lack a conserved nuclear retention element, suggesting a direct association between PAM mRNA and La protein in vivo. Reporter assays using a chimeric mRNA that combined luciferase and the 3' UTR of PAM mRNA demonstrated a decrease of the reporter activity due to an increase in the nuclear localization of reporter mRNAs, while the deletion of the 15-nt La binding site led to their clear-cut cytoplasmic relocalization. The results suggest an important role for the La protein in the modulation of PAM expression, possibly by mechanisms that involve a nuclear retention and perhaps a processing of pre-PAM mRNA molecules.


Figures

FIG. 1.
FIG. 1.
Characterization of the PAM mRNA-protein complex in rat anterior pituitary gland and U87 cells. UV cross-linking with the 32P-labeled PAM RNA 3′ UTR and nuclear (Nuc; lanes 2 and 3) or cytoplasmic (Cyto; lanes 5 and 6) extracts (30 μg) from rat anterior pituitary gland and U87 cells, and purified PAM mRNA-binding protein (50 ng) (lane 7). No RNA-protein complex was observed in the absence of protein extracts (lane 2). Lane 1 showed the PAM 1 probe in the absence of RNase T1. The RNA-protein complex at 60 kDa is indicated by an arrowhead.
FIG. 2.
FIG. 2.
Identification of the La protein as a potential PAM mRNA-binding protein. (A) Proteins from rat anterior pituitary extracts were affinity purified and fractionated by SDS-polyacrylamide gel electrophoresis. The gel lane that is obtained with the bands of 44, 47/48, 50, and 68 kDa is cut into several slices, which are then tryptic digested in gel. (B) Only the mass spectrum of the peptides that were generated from band 2 at 47/48 kDa in panel A are shown. The mass differences between the y-ion series indicate the amino acid series, which is shown above each spectrum. As this is an ion series, the sequence is written in the direction, from left to right, from the carboxy to the amino terminus. m/z, mass-to-charge ratio. (C) The peptide-sequencing data that are obtained from the mass spectra were searched against the protein databases (SWISS-PROT database). The positions of the four identified peptides are highlighted in bold in the La protein sequence.
FIG. 3.
FIG. 3.
La protein binds to the 3′ UTR of PAM RNA in vitro. (A) UV cross-linking of human PAM RNA 3′ UTR (PAM 1 probe) with nondepleted and La-immunodepleted U87 cytoplasmic extract (lanes 1 and 2) and bacterially produced His-La added to La-immunodepleted U87 cytoplasmic extract (lane 3). (B) Antibody to human La protein supershifts the PAM mRNA-BP/RNA complex. Gel mobility shift assay with PAM 1 probe in the absence (lanes 2 and 9) and presence (lanes 3 and 10) of U87 cytoplasmic extract. No complex can be observed when the PAM 1 probe is incubated only with anti-La (SW5) (lane 4). The presence of increasing amounts of anti-La (SW5) with U87 cytoplasmic extracts can supershift the complex (lanes 5 to 8). A complete supershift of the band at 60 kDa can be seen at a high concentration of anti-La protein (400 ng). However, no supershift is observed with anti-CRLR used as a negative control (lanes 11 and 12).
FIG. 4.
FIG. 4.
Association of La with PAM mRNA in vivo. (A) Structure of the PAM gene in the region of exons 26 and 27. Human genomic DNA (10 ng) was amplified (lane 2) using a sense oligonucleotide primer within exon 26 (bp 2917 to 2935) and antisense oligonucleotide within exon 27 (bp 3102 to 3121) of human PAM 1. Plasmid DNA (100 pg) was used as a control (lane 3). Amplified fragments were separated on a 1.6% agarose gel, and the ethidium bromide-stained gel is shown. Apparent molecular weights are shown to the side of the panel. (B) Equal aliquotsof purified U87 total RNA isolated from the input (lane 1), preimmune serum, or La-immunodepleted cytoplasmic extract or from anti-La or anti-CRLR immunoprecipitates (lanes 6 to 9) and from the supernatants (Super; lanes 2 to 5) of the immunoprecipitates were assayed by RT-PCR to detect PAM, GAPDH, and hY1 small cytoplasmic RNA (scRNA) transcripts. The reaction in lane 10 contained anti-La immunoprecipitated RNA, but the RT enzyme mix was heat inactivated prior to use; the reaction in lane 11 contained water instead of RNA. (C) Purified U87 nuclear RNA isolated from preimmune serum or anti-La immunoprecipitates (lanes 5 and 6) and from the supernatants (Super; lanes 3 and 4) of the immunoprecipitates were assayed by RT-PCR to detect PAM RNA transcripts. Lanes 1 and 2 were used as a control as described in panel A. Lanes 7 and 8 were as described for lanes 10 and 11 in panel B. (D) To assess the purity of the nuclear (N) and cytoplasmic (C) fractions, immunoblot analysis was done with anticalnexin or antihistone H1.
FIG. 5.
FIG. 5.
Quantification of RNA-protein interactions. (A) Representative gel mobility shift assay with increasing amounts of the hLa protein and a constant amount of 3′ UTR PAM mRNA. Lane 1, free probe; lanes 2 to 11, probe plus His-hLa in the amounts indicated; M, multimer of the probe; fp, free probe. (B) The percent 32P-PAM 1 RNA bound was plotted against His-hLa concentration to generate a theoretical saturation binding curve (inset). The stoichiometry of the interaction of hLa with PAM 1 RNA, as determined by the slope of the line in the inset graph, was about 1:1. The dissociation constant was calculated using the following equation: log (percent bound/percent unbound) + 2 = n{log[His-hLa (nM)] + 1} − log KD. The KD was estimated to be 155 nM for hLa-PAM 1 RNA. (C) Representative gel mobility shift assay with increasing amount of His-hLa protein and a constant amount of oligo(U). Lane 1, free probe; lanes 2 to 9, probe plus hLa in the amounts indicated. (D) The percent 32P-oligo(U) bound was plotted against the concentration of His-hLa to generate a theoretical saturation binding curve. The data from the saturation binding curve were transformed (inset). The KD was estimated to be 38 nM.
FIG. 6.
FIG. 6.
La protein core binding site maps within the 15-nt segment of nt 3769 to 3783 of the PAM 3′ UTR RNA. (A) Summary of deletion analysis of the PAM 3′ UTR band shift complex. The striped bar is a representation of a complete 662-nt PAM 3′ UTR. RNA probes were prepared as described in Materials and Methods. The first and last nucleotides of each transcript are indicated. (B) UV cross-linking was performed with hLa protein (200 ng) and each described RNA probe. The same data were obtained with U87 cytoplasmic extracts (30 μg).
FIG. 6.
FIG. 6.
La protein core binding site maps within the 15-nt segment of nt 3769 to 3783 of the PAM 3′ UTR RNA. (A) Summary of deletion analysis of the PAM 3′ UTR band shift complex. The striped bar is a representation of a complete 662-nt PAM 3′ UTR. RNA probes were prepared as described in Materials and Methods. The first and last nucleotides of each transcript are indicated. (B) UV cross-linking was performed with hLa protein (200 ng) and each described RNA probe. The same data were obtained with U87 cytoplasmic extracts (30 μg).
FIG. 7.
FIG. 7.
Potential regulation of PAM gene expression by La protein. (A) U87 cells were transfected with increasing amounts (0, 2, 5, 10, and 20 μg) of hLa plasmid. The Western blot analysis demonstrates that La protein accumulates in the cell at increasingly larger amounts as the amount of transfected La plasmid increases. β-Actin levels were monitored as controls for loading. (B to F) Effect of La protein overexpression on PAM RNA levels in nuclear and cytosolic fractions. Nuclear (NUC), cytosolic (CYT), and total RNA were prepared from U87 cells at 24 or 48 h posttransfection, and slot blots containing 10 μg of each RNA were prehybridized to probes corresponding to hPAM cDNA (B), and the I-PAM probe (D), respectively. The slot was subsequently stripped and reprobed with a cDNA corresponding to the GAPDH probe (not shown) and U6 RNA probe (E) to normalize data for quantification. The autoradiograms were densitometrically analyzed, and the levels of PAM RNA in panel B were normalized to levels of GAPDH mRNA on the same blot (C). The levels of nuclear PAM RNA in panel D were quantified and normalized to the levels of U6 RNA in panel E (F). Each bar represents the mean ± SEM of two independent experiments. The asterisks indicate that the values for samples 4 and 5 are significantly different from samples 1, 2, and 3 (***, P < 0.0001).
FIG. 8.
FIG. 8.
Effect of high expression of hLaΔ316-332 on subcellular localization of PAM mRNA. U87 cells were transfected with increasing amounts of the hLaΔ316-332 plasmid (0, 2, 5, 10, and 20 μg), and 24 or 48 h later, cells were homogenized to prepare RNA and protein extracts, respectively. (A) hLaΔ316-332 protein levels in total extract were detected by Western blotting. β-Actin levels were monitored as controls for loading. (B) Representative gel mobility shift assay with U87 cytoplasmic extracts transfected with 20 μg of either empty vector (lane 1) or GFP-hLaΔ316-332 plasmid (lane 2). (C) PAM mRNA levels in total, cytosolic, and nuclear RNA were analyzed by slot blot and quantified as described in the legend of Fig. 7. (D) Levels of PAM mRNA were normalized to GAPDH mRNA levels. (E) Levels of nuclear PAM RNA detected with intronic PAM probe were normalized to levels of nuclear U6 RNA. CYT, cytosolic RNA; NUC, nuclear RNA.
FIG. 8.
FIG. 8.
Effect of high expression of hLaΔ316-332 on subcellular localization of PAM mRNA. U87 cells were transfected with increasing amounts of the hLaΔ316-332 plasmid (0, 2, 5, 10, and 20 μg), and 24 or 48 h later, cells were homogenized to prepare RNA and protein extracts, respectively. (A) hLaΔ316-332 protein levels in total extract were detected by Western blotting. β-Actin levels were monitored as controls for loading. (B) Representative gel mobility shift assay with U87 cytoplasmic extracts transfected with 20 μg of either empty vector (lane 1) or GFP-hLaΔ316-332 plasmid (lane 2). (C) PAM mRNA levels in total, cytosolic, and nuclear RNA were analyzed by slot blot and quantified as described in the legend of Fig. 7. (D) Levels of PAM mRNA were normalized to GAPDH mRNA levels. (E) Levels of nuclear PAM RNA detected with intronic PAM probe were normalized to levels of nuclear U6 RNA. CYT, cytosolic RNA; NUC, nuclear RNA.
FIG. 9.
FIG. 9.
Effect of La protein expression on PAM specific activity in U87 cells. U87 cells were transfected with indicated amounts of hLa plasmid or pcDNA 3.1 vector for 48 h. PAM-specific activity in cell extracts (A) and medium (B) was measured as described in Materials and Methods. Data from three experiments (n = 3 for each plasmid concentration in three experiments) were used to calculate the mean specific activity; each sample was assayed in duplicate. Data are presented as mean ± SEM. The asterisks indicate that the values are significantly different between both groups of cells (**, P < 0.01; ***, P < 0.001).
FIG. 10.
FIG. 10.
Effect of the PAM 3′ UTR on the translational efficiency of chimeric RNA. (A) Schematic representation of luciferase reporter constructs containing the 3′ UTR of PAM (b) or the 3′ UTRΔ3769-3783 (c) and pLuc vector (a). All the constructs were under the simian virus 40 (SV40) promoter. (B) Luciferase reporter assay. U87 cells were transiently cotransfected with the indicated luciferase reporter constructs and the Renilla reporter construct (pRL-TK; see Materials and Methods) for 24 h. The results are presented as ratios of firefly luciferase reporter activity over sea pansy (Renilla) luciferase activity, the latter being used as a control. Each bar represents the mean ± SEM; asterisks indicate that the values are significantly different between a, b, and c (***, P < 0.0001). Similar data were obtained from three independent experiments. (C) U87 cells were transfected with increasing concentrations of b and c. Nuclear and cytosolic RNAs were prepared 24 h later. Slot blots containing 10 μg of each nuclear and cytosolic RNA sample were hybridized to probe corresponding to firefly luciferase cDNA and exposed to X-ray film at −70°C with an intensifying screen. The blot was reprobed with 32P-labeled GAPDH probe to normalize data for quantification. (D) Quantification analysis of the blots was performed as described in the legend of Fig. 7. Each bar represents the mean ± SEM of three independent experiments. For cytosolic (CYT) RNA, asterisks indicate that the values are significantly different between a and b versus c; for nuclear RNA (NUC), asterisks indicate that the values are significantly different between a and c versus b.
FIG. 11.
FIG. 11.
Effect of high expression of hLaΔ316-332 on luciferase activity. U87 cells were transiently cotransfected with the luciferase reporter containing the 3′ UTR of PAM (see construct b in Fig. 10 A) and increasing amounts of either hLa-wt or hLaΔ316-332 as shown. After 48 h the cells were lysed, and the results are presented as ratios of firefly luciferase activity and sea pansy (Renilla) luciferase activity, used as a control. Data from three experiments (n = 3 for each plasmid concentration in three experiments) were used to calculate the mean luciferase activity. Data are presented as mean ± SEM. The asterisks indicate that the values are significantly different (P < 0.001).

References

    1. Adilakshmi, T., and R. O. Laine. 2002. Ribosomal protein S25 mRNA partners with MTF-1 and La to provide a p53-mediated mechanism for survival or death. J. Biol. Chem. 277:4147-4151. - PubMed
    1. Alfano, C., D. Sanfelice, J. Babon, G. Kelly, A. Jacks, S. Curry, and M. R. Conte. 2004. Structural analysis of cooperative RNA binding by the La motif and central RRM domain of human La protein. Nat. Struct. Mol. Biol. 11:323-329. - PubMed
    1. Ali, N., G. J. Pruijn, D. J. Kenan, J. D. Keene, and A. Siddiqui. 2000. Human La antigen is required for the hepatitis C virus internal ribosome entry site-mediated translation. J. Biol. Chem. 275:27531-27540. - PubMed
    1. Alspaugh, M. A., and E. M. Tan. 1975. Antibodies to cellular antigens in Sjogren's syndrome. J. Clin. Invest. 55:1067-1073. - PMC - PubMed
    1. Boelens, W. C., I. Palacios, and I. W. Mattaj. 1995. Nuclear retention of RNA as a mechanism for localization. RNA 1:273-283. - PMC - PubMed

Publication types

MeSH terms