. 2005 Sep;25(17):7734-42.
doi: 10.1128/MCB.25.17.7734-7742.2005.

Epidermal growth factor receptor dimerization and activation require ligand-induced conformational changes in the dimer interface

Affiliations

Epidermal growth factor receptor dimerization and activation require ligand-induced conformational changes in the dimer interface

Jessica P Dawson et al. Mol Cell Biol. 2005 Sep.

Abstract

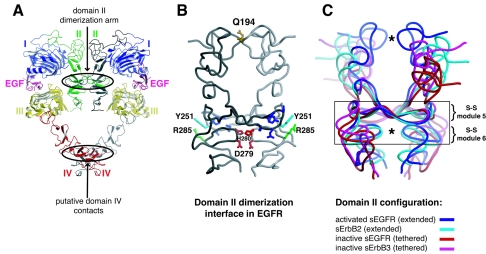
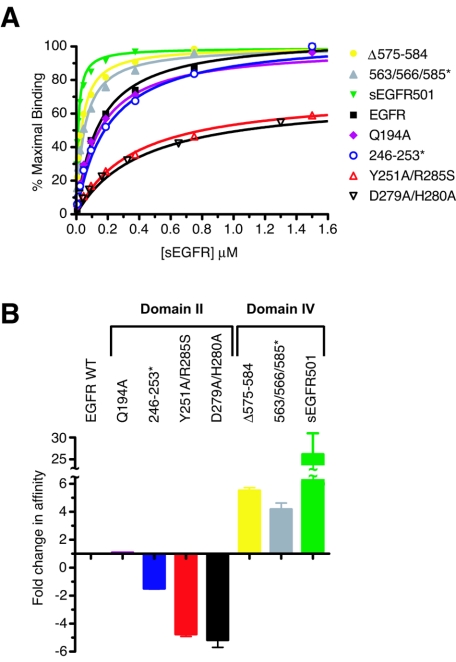
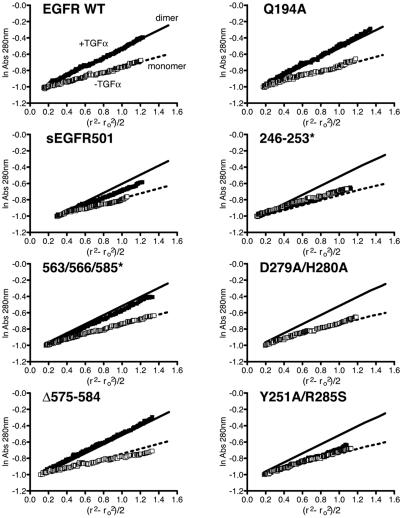
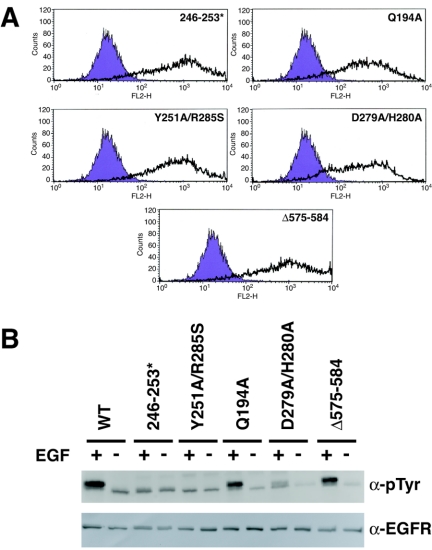
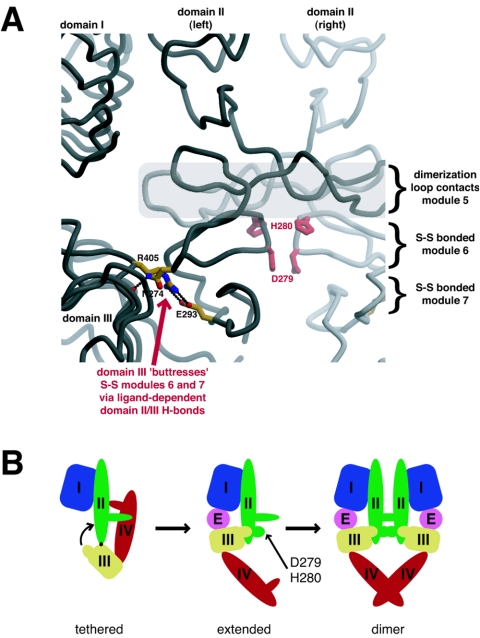
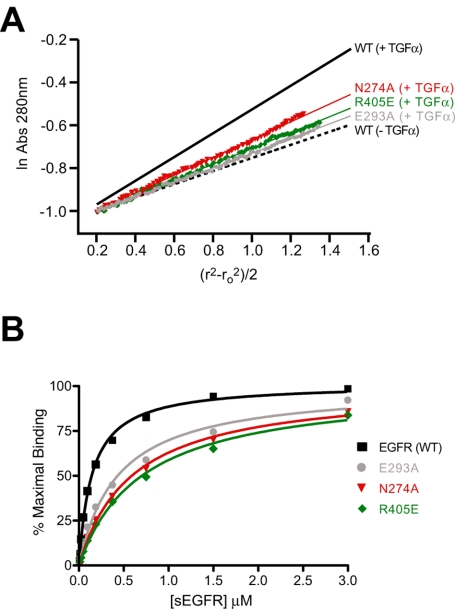
Structural studies have shown that ligand-induced epidermal growth factor receptor (EGFR) dimerization involves major domain rearrangements that expose a critical dimerization arm. However, simply exposing this arm is not sufficient for receptor dimerization, suggesting that additional ligand-induced dimer contacts are required. To map these contributions to the dimer interface, we individually mutated each contact suggested by crystallographic studies and analyzed the effects on receptor dimerization, activation, and ligand binding. We find that domain II contributes >90% of the driving energy for dimerization of the extracellular region, with domain IV adding little. Within domain II, the dimerization arm forms much of the dimer interface, as expected. However, a loop from the sixth disulfide-bonded module (immediately C-terminal to the dimerization arm) also makes a critical contribution. Specific ligand-induced conformational changes in domain II are required for this loop to contribute to receptor dimerization, and we identify a set of ligand-induced intramolecular interactions that appear to be important in driving these changes, effectively "buttressing" the dimer interface. Our data also suggest that similar conformational changes may determine the specificity of ErbB receptor homo- versus heterodimerization.


Figures

FIG. 1.
FIG. 1.
Contacts across the sEGFR dimer interface. (A) A model for the sEGFR dimer is shown, generated with the coordinates of the EGF/sEGFR complex (24) to which domain IV has been added according to the relationship between domains III and IV in the structure of intact (monomeric) sEGFR (12). This model shows that domain II (green) forms much of the dimer interface and suggests that domain IV (red) may also contribute, as indicated in further crystallographic studies (S. Yokoyama, unpublished data). Domains I, II, III, and IV are labeled, as is bound EGF. (B) A close-up view of domain II from the sEGFR:TGF-α dimer structure (17) as an alpha carbon trace, with domain II of the right-hand protomer shaded light gray and domain II of the left-hand protomer shaded dark gray. The amino acids involved in crystallographically observed dimer contacts are colored. The Q194 side chain (yellow) makes contacts across the interface close to the N terminus of domain II. Residues in the dimerization arm that make intermolecular contacts are dark blue if they were mutated in the 246-253* mutant (Y246, N247, T249, Q252, and M253), green if they were mutated in the Y251A/R285S mutant (R285), and cyan if they were altered in both mutants (Y251). D279 and H280 in disulfide-bonded module 6 are red. (C) Domain II of each protomer from the sEGFR/TGF-α dimer is represented as a dark blue stylized backbone worm. Regions of interface contact (shown in panel B) are denoted by asterisks. Using the dimerization arm as a reference point, we superimposed domain II from each of the other published ErbB receptor structures (8, 9, 12) onto each protomer in the sEGFR dimer. Thus, a copy of domain II from the extended sErbB2 monomer (9) has been superimposed (in cyan) onto each dark blue sEGFR domain II. Similarly, we have superimposed a separate copy of domain II from the sEGFR monomer (red) and the sErbB3 unliganded monomer (magenta) onto each domain II present in the sEGFR dimer. This provides a view of the interactions that each alternate domain II configuration can form across the dimer interface. The region shown in our mutational analysis to contribute >75% of the dimerization energy (disulfide-bonded modules 5 and 6) is boxed. It is apparent that the module 6 contact point (including D279 and H280 in sEGFR) is “withdrawn” from the dimer interface in the red and magenta (monomeric) domain II configurations compared to the position seen in the active configurations (blue and cyan).
FIG. 2.
FIG. 2.
Effects of mutations and deletions on ligand binding by sEGFR, assessed by using SPR. (A) Mean best-fit binding curves for binding of each sEGFR mutant to immobilized EGF are plotted, together with data points for a representative experiment (at least three independent experiments were performed for each analysis). Mutants that bind EGF with an affinity that is equal to (or greater than) that of the wild-type sEGFR are represented by solid data points, while those that bind more weakly than wild-type are represented with open data points, according to the key provided in the figure. The Y251A/R285S and D279A/H280A mutants, which are the weakest binders, at sEGFR concentrations of ∼10 μM, do reach saturation giving binding signals that are 94% (2,130 RU) and 98% (2,230 RU) of maximal wild-type binding for the Y251A/R285S and D279A/H280A mutants, respectively. (B) A bar graph summarizes the relative affinities of each sEGFR mutant for immobilized EGF. The wild-type sEGFR is set at a value of 1. Values for mutated forms of sEGFR are reported as a fold increase (positive values) or decrease (negative values) in affinity. For example, with a KD(EGF) of 877 nM, the D279A/H280A mutant binds EGF fivefold more weakly than does the wild type (KD = 175 nM), giving a fold change in affinity of −5. In contrast, with a KD(EGF) of 7.8 nM, sEGFR501 binds EGF 22-fold more strongly than does the wild type, giving a fold change in affinity of +22. Error bars represent the standard deviation for at least three separate measurements, as reported in Table 1.
FIG. 3.
FIG. 3.
Analysis of TGF-α-induced dimerization of sEGFR mutants using sedimentation equilibrium analytical ultracentrifugation. Raw analytical ultracentrifugation data are plotted as the natural logarithm (ln) of absorbance at 280 nm against a function of the radius squared (r2ro2)/2, where r is the radial position in the sample and ro is the radial position of the meniscus. For a single species, this representation gives a straight line with slope proportional to its molecular mass. The data are shown for experiments run with an sEGFR concentration of 10 μM, with or without the addition of 12 μM TGF-α, and at a rotor speed of 6,000 rpm. For each protein, data obtained with added ligand are represented by filled squares, and data obtained without added ligand are represented by open squares. For wild-type sEGFR, best-fit straight lines for the data are shown with TGF-α (solid black line), corresponding to dimer (as marked) or without TGF-α (broken black line), corresponding to monomer (as marked). These same straight lines are superimposed on all other plots in the figure, as representative results for a dimerizing and nondimerizing sEGFR molecule. Estimates of dimerization KD values for a 1:1 sEGFR/TGF-α complex, from a more complete analysis of the data (see Materials and Methods), are listed in Table 2.
FIG. 4.
FIG. 4.
Analysis of ligand-activation of intact EGFR mutants. (A) Pools of S2 cells expressing full-length EGFR mutants were analyzed by FACS as described in Materials and Methods. The filled traces represent data from control parental S2 cells treated with a phycoerythrin-conjugated antibody against the EGFR extracellular region, while the open traces represent data from the transfected stable cell pools analyzed in the same fashion. The marked right shift in each case demonstrates that each chimera is expressed appropriately at the cell surface and that our pools sample a wide-range of expression levels. A total of 10,000 cells were analyzed for each FACS analysis. (B) S2 cells stably expressing the noted EGFR mutants were serum starved overnight and then chilled and left unstimulated (−) or treated with 100 ng of EGF/ml on ice for 10 min. Receptor autophosphorylation in normalized whole-cell lysates was analyzed by immunoblotting with antiphosphotyrosine (α-pTyr) antibody (upper blot) and an antibody specific for the EGFR intracellular domain (α-EGFR) (lower blot). Similar studies with TGF-α gave identical results. Studies to assess the dependence on EGF concentration of phosphorylation of the Δ575-584 mutant showed no difference from the wild type.
FIG. 5.
FIG. 5.
Domain III “buttresses” the C terminus of domain II for participation in the dimer interface. (A) In the structure of the ligand-bound sEGFR dimer, a “buttressing” interaction of domain III with the “back” of domain II sets up contacts across the dimer interface. A close-up view of domain II in the interface of the sEGFR/TGF-α dimer is shown (17), with the positions of domains I and III marked at the left. The contact region involving D279 and H280 (in disulfide-bonded module 6) is indicated with red side chains, and the dimerization arm region (in disulfide-bonded module 5) is marked with a transparent gray box. In the ligand-activated conformation, domain III lies against the “back” of domain II and interacts with the face of domain II that projects away from the dimer interface. The side chain from R405 of domain III forms a salt bridge with E293 from module 7 of domain II. Simultaneously, the side chain of N274 (from module 6 of domain II) forms a hydrogen bond with the domain III backbone. These hydrogen-bonds and salt bridges are marked and appear to “buttress” modules 6 and 7 of domain II so that the D279/H280 loop of module 6 is projected further into the dimer interface to make contact with the adjacent receptor molecule. (B) Upon ligand binding to the tethered (monomeric) form of sEGFR, domain III is swung from the position shown in the left-hand panel of this diagram (where it is held by the domain II/IV tether) into a position where it lies against the back of domain II, allowing the buttressing interactions shown in detail in panel A. This movement of domain III occurs about an axis represented by the black circle between domains II and III and is depicted with a curved arrow. The position of R405 in domain III is represented by an (exaggerated) protrusion from domain III that is shown projecting into domain II when swung into position and buttressing the critical dimer contacts, including those mediated by D279 and H280. This dimer contact is depicted as an (exaggerated) ligand-induced projection from the C-terminal part of domain II that makes contact across the dimer interface in the right-hand part of the figure.
FIG. 6.
FIG. 6.
Effects of buttress mutations on ligand binding and receptor dimerization. (A) Raw analytical ultracentrifugation data are plotted as described for Fig. 3 for TGF-α-bound N274A, R405E, and E293A mutants of sEGFR. For comparison, solid and dashed lines from Fig. 3 for wild-type sEGFR dimer (+TGF-α) and monomer (−TGF-α), respectively, are also plotted. TGF-α-induced dimerization of E293A and R405E sEGFR was essentially undetectable, whereas the N274A mutant gave an approximate KD of 50 μM. (B) Representative curves from SPR experiments are shown for binding of each sEGFR buttressing mutant to immobilized EGF. All three mutants showed ∼4-fold-reduced binding affinity compared to the wild type. For EGF binding, apparent KD values were 555 ± 43 nM for N274A, 472 ± 31 nM for E293A, and 671 ± 25 nM for R405. For TGF-α binding, the apparent KD values were 1,420 ± 150 nM for N274A, 1,332 ± 104 nM for E293A, and 1,470 ± 93 nM for R405. Three independent experiments were performed for each analysis.

References

    1. Arteaga, C. L. 2003. ErbB-targeted therapeutic approaches in human cancer. Exp. Cell Res. 284:122-130. - PubMed
    1. Beerli, R. R., and N. E. Hynes. 1996. Epidermal growth factor-related peptides activate distinct subsets of ErbB receptors and differ in their biological activities. J. Biol. Chem. 271:6071-6076. - PubMed
    1. Berezov, A., J. Chen, Q. Liu, H. T. Zhang, M. I. Greene, and R. Murali. 2002. Disabling receptor ensembles with rationally designed interface peptidomimetics. J. Biol. Chem. 277:28330-28339. - PubMed
    1. Berger, M. B., J. M. Mendrola, and M. A. Lemmon. 2004. ErbB3/HER3 does not homodimerize upon neuregulin binding at the cell surface. FEBS Lett. 569:332-336. - PubMed
    1. Blume-Jensen, P., and T. Hunter. 2001. Oncogenic kinase signaling. Nature 411:355-365. - PubMed

Publication types