. 2005 Sep 21;24(18):3291-300.
doi: 10.1038/sj.emboj.7600793. Epub 2005 Aug 18.

CTCF binding and higher order chromatin structure of the H19 locus are maintained in mitotic chromatin

Affiliations

CTCF binding and higher order chromatin structure of the H19 locus are maintained in mitotic chromatin

Les J Burke et al. EMBO J. .

Abstract

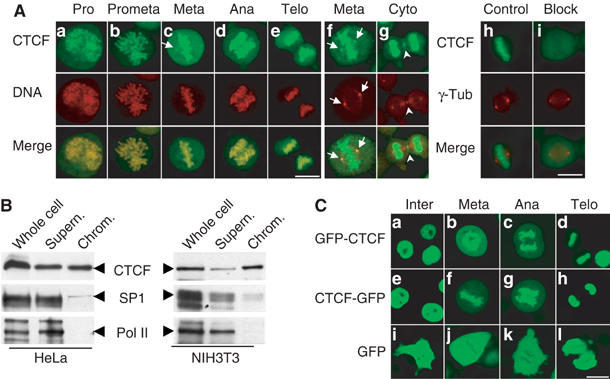
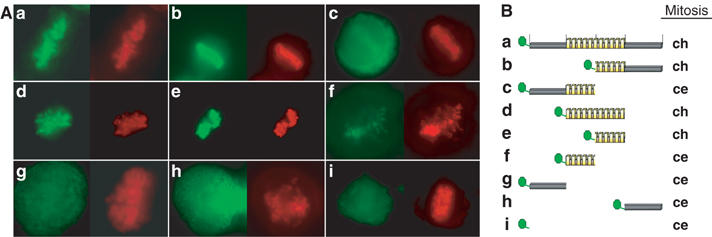
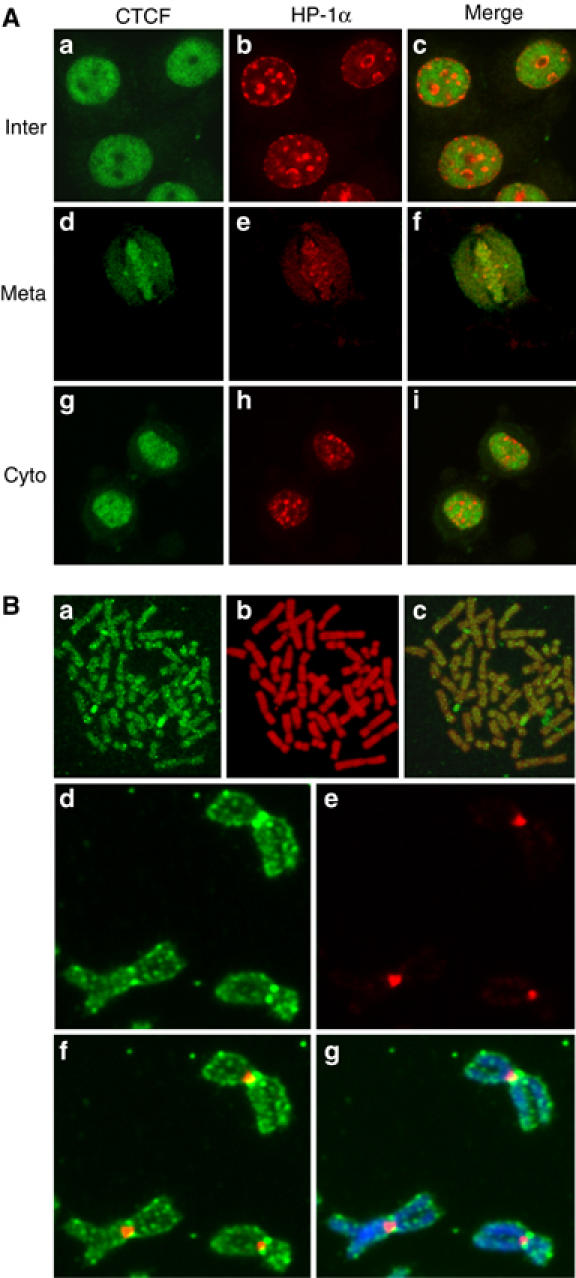
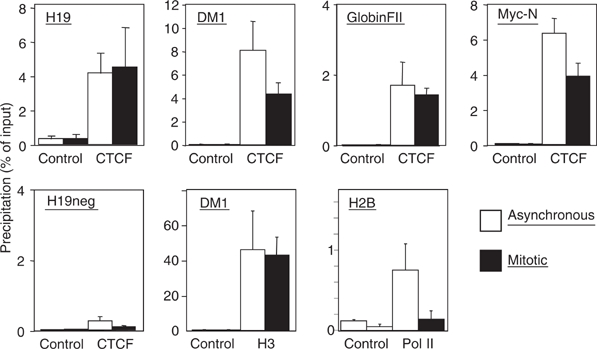
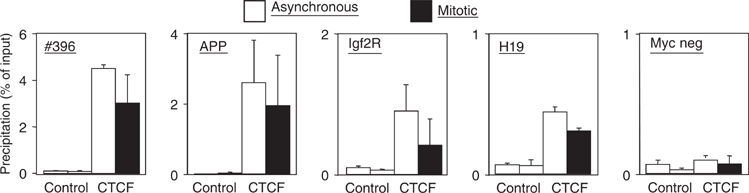
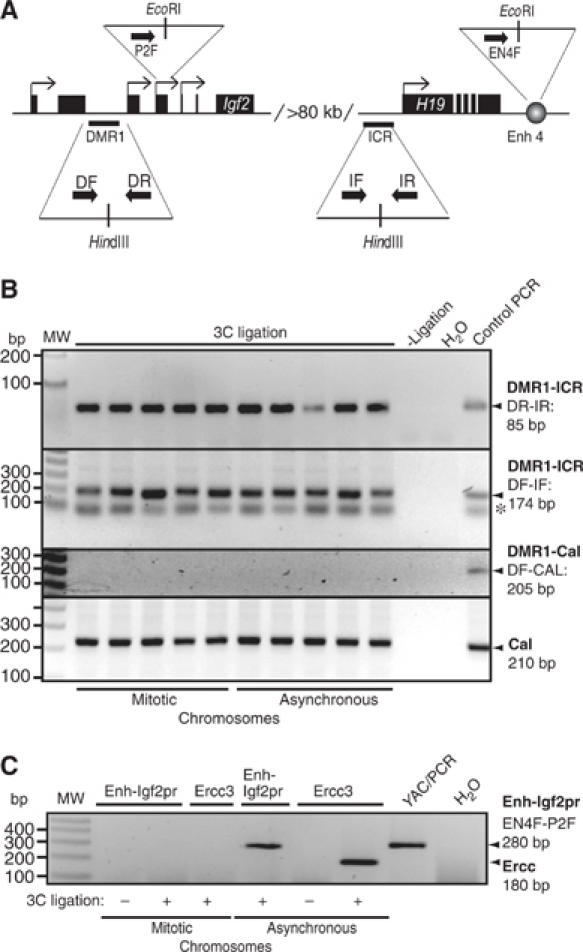
Most of the transcription factors, RNA polymerases and enhancer binding factors are absent from condensed mitotic chromosomes. In contrast, epigenetic marks of active and inactive genes somehow survive mitosis, since the activity status from one cell generation to the next is maintained. For the zinc-finger protein CTCF, a role in interpreting and propagating epigenetic states and in separating expression domains has been documented. To test whether such a domain structure is preserved during mitosis, we examined whether CTCF is bound to mitotic chromatin. Here we show that in contrast to other zinc-finger proteins, CTCF indeed is bound to mitotic chromosomes. Mitotic binding is mediated by a portion of the zinc-finger DNA binding domain and involves sequence specific binding to target sites. Furthermore, the chromatin loop organized by the CTCF-bound, differentially methylated region at the Igf2/H19 locus can be detected in mitosis. In contrast, the enhancer/promoter loop of the same locus is lost in mitosis. This may provide a novel form of epigenetic memory during cell division.


Figures

Figure 1
Figure 1
CTCF is associated with mitotic chromosomes. (A) Indirect immunofluorescence experiments were carried out on HeLa cells fixed with ethanol/acetic acid. The individual stages within mitosis, including prophase (a), prometaphase (b), metaphase (c), anaphase (d) and telophase (e), were selected according to the chromosomal morphology. CTCF was stained with the anti-CTCF antibody and a fluorescein isothiocyanate (FITC)-conjugated secondary antibody (green), and DNA was stained with propidium iodide (red) (a–e). The overlay shows colocalization of CTCF and mitotic chromosomes. The arrows indicate the position of mitotic centrosomes. Indirect double immunofluorescence with antibodies against CTCF (green) and γ-tubulin (red) identifies CTCF in the mitotic centrosomes (f) and midbody (g). To test antibody specificity, the primary antibodies against CTCF and γ-tubulin were preincubated with bacterially expressed and GST-purified GST-CTCF (i) or GST (h). (B) Western blot with anti-CTCF, anti-Sp1 and anti-Pol II antibodies of HeLa and NIH3T3 whole cell extract, mitotic chromosome fraction (chrom.) and the corresponding supernatant. The respective proteins are indicated by arrows. (C) Living HeLa cells stably expressing GFP-CTCF (a–d), CTCF-GFP (e–h) and GFP (i–l) were analyzed by confocal microscopy and grouped according to cell cycle stage. Scale bar, 10 μm.
Figure 2
Figure 2
Delineation of the mitotic chromosome association domain of CTCF. (A) HeLa cells were transiently transfected with the GFP and GFP-CTCF constructs as schematically illustrated in (B). Except for the pEGFPC2 construct, all of the constructs resulted in interphase in a nuclear GFP signal (not shown). Living mitotic cells were analyzed by fluorescence microscopy after transfection of pEGFPC2-CTCF_f.l. (a), pEGFPC1-CTCF_ΔN (b), pEGFPC2-CTCF_ΔC (c), pEGFPC2-CTCF_Zn (d), pEGFPC2-CTCF_ZnC (e), pEGFPC2-CTCF_ZnN (f), pEGFPC2-CTCF_N.t. (g), pEGFPC2-CTCF_C.t. (h) and pEGFPC2 (i) (green) and stained with Hoechst 33342 (red). GFP signals are summarized in panel B. Mitotic GFP location is indicated by chromosomal (ch) or cellular distribution including the whole cellular space (ce). The N-terminal part of the zinc-finger domain (f) shows chromosomal localization as well, but at much reduced levels as compared to the full-length zinc-finger region or the C-terminal part of the zinc-finger domain.
Figure 3
Figure 3
The cell cycle-dependent subcellular distribution of CTCF and HP1α. (A) Double indirect immunofluorescence experiments were carried out in HeLa cells fixed with ethanol/acetic acid. Cells were stained with primary antibodies against CTCF and HP1α followed by FITC-conjugated (green) or Texas red dye-conjugated (red) secondary antibodies, respectively. Interphase (a–c), metaphase (d–f) and early cytokinesis (g–i) are shown. The merged panel allows the comparison of the localization of CTCF and HP1α. (B) Mitotic chromosome spreads were prepared with synchronized human primary amnion cells (46,XX) (a–c). Indirect immunofluorescence was carried out with the anti-CTCF antibody and an FITC-conjugated secondary antibody (green). DNA was stained with propidium iodide (red). The overlay shows colocalization of CTCF and DNA. Unfixed HeLa cell mitotic chromosome spreads were stained with Hoechst and antibodies against CTCF and HP1α (d–g). The slide was visualized for CTCF (d), HP1α (e), CTCF+HP1α (f) and CTCF+HP1α+Hoechst (g).
Figure 4
Figure 4
Human CTCF target sites are occupied in interphase and mitosis. Chromatin prepared from interphase HeLa cells (asynchronous) and mitotic HeLa cells was precipitated with antibodies against CTCF or RNA Pol II or histone H3 (H3). To control unspecific precipitation preimmune serum in the case of CTCF and H3 or an unrelated antibody (IgG) in the case of Pol II (control) was used. Precipitates were tested by real-time PCR for the presence of DNA sequences of known CTCF target sites at the myc-N site (Lutz et al, 2003), the DM-1 locus (Filippova et al, 2001), the H19 locus (Bell and Felsenfeld, 2000) and the β-globin insulator FII (Tanimoto et al, 2003). A non-CTCF binding site (H19neg) could not be detected in the precipitates. The values are expressed as percentage of precipitated input chromatin. Error bars indicate the standard error of 2–3 independent chromatin preparations.
Figure 5
Figure 5
Mouse CTCF target sites are occupied in interphase and mitosis. Chromatin prepared from interphase NIH3T3 cells (asynchronous) and mitotic NIH3T3 cells was precipitated with antibodies against CTCF or with preimmune serum (control). Precipitates were tested by real-time PCR as in Figure 4 for the presence of DNA sequences of known CTCF target sites at the mouse APP promoter (unpublished), the CTCF site at the Igf2R gene (unpublished), the #396 site (Mukhopadhyay et al, 2004) and the H19 ICR (Bell and Felsenfeld, 2000; Hark et al, 2000; Kanduri et al, 2000; Szabo et al, 2000). The non-CTCF binding site (Myc neg) could not be detected in the precipitates.
Figure 6
Figure 6
The Igf2 DMR1–H19 ICR interaction is an epigenetic mark. (A) Schematic representation of the primers used. The Igf2 DMR1 and H19 ICR as well as Igf2 promoter 2 and H19 enhancers, which are separated by more than 80 kb of intervening sequences, are indicated in the image. The primers used are DF and DR for Igf2 DMR1, IF and IR for H19 ICR, P2F for the Igf2 promoter 2 and EN4F for the enhancer 4 downstream of H19. (B) Long-distance ICR/DMR1 interaction is maintained in mitotic chromosomes. Chromatin interaction between the H19 ICR and Igf2 DMR1 was studied by 3C analysis using chromatin from NIH3T3 cells and two different primer combinations. PCR products from primer combinations DR plus IR, and DF plus IF were run on 2.5 and 1.5% agarose gel, respectively, with ethidium bromide staining. The last lane in both the gels shows the PCR products with template obtained after digestion and ligation of YAC (for Igf2 DMR1 and H19 ICR) or a control plasmid (containing the DMR1 and Calreticulin sequences, see below). The band in all the lanes labeled with an asterisk is a nonspecific band, which does not hybridize to a specific DMR1 probe (not shown). All individual PCR analyses of five independent 3C samples were performed at least twice. To account for random background interactions, we performed PCR using one primer each from Calreticulin (CalR) and Igf2 DMR1 as indicated in the panel. The control template for this analysis was generated by mixing, digesting and ligating CalR and Igf2 DMR1 HindIII amplicons in equimolar amounts. The CalR products were used for normalizing signals to account for crosslinking efficiency of mitotic/asynchronous chromosomes with previously used primers (Tolhuis et al, 2002). (C) Long-distance enhancer/promoter interaction is not maintained in mitosis. One of the samples (#3 in both mitotic and asynchronous chromosome preparations) presented in panel B was subjected to additional 3C analysis to test for unspecific interaction. The interactions within the Ercc3 locus (encompassing 14 kb) (Palstra et al, 2003) and between the H19 enhancer and Igf2 promoter 2 (encompassing 101 kb) (Tiwari et al, unpublished observation) were examined in mitotic and asynchronous chromosomes. In both cases, the interaction seen in asynchronous cells (Ercc and Enh-Igf2pr) is lost in mitotic chromatin. Signals were always dependent on the ligation step (3C ligation).

References

    1. Adams RR, Carmena M, Earnshaw WC (2001) Chromosomal passengers and the (aurora) ABCs of mitosis. Trends Cell Biol 11: 49–54 - PubMed
    1. Akoulitchev S, Reinberg D (1998) The molecular mechanism of mitotic inhibition of TFIIH is mediated by phosphorylation of CDK7. Genes Dev 12: 3541–3550 - PMC - PubMed
    1. Bell AC, Felsenfeld G (2000) Methylation of a CTCF-dependent boundary controls imprinted expression of the Igf2 gene. Nature 405: 482–485 - PubMed
    1. Bellier S, Dubois MF, Nishida E, Almouzni G, Bensaude O (1997) Phosphorylation of the RNA polymerase II largest subunit during Xenopus laevis oocyte maturation. Mol Cell Biol 17: 1434–1440 - PMC - PubMed
    1. Berube NG, Smeenk CA, Picketts DJ (2000) Cell cycle-dependent phosphorylation of the ATRX protein correlates with changes in nuclear matrix and chromatin association. Hum Mol Genet 9: 539–547 - PubMed

Publication types

MeSH terms