. 2006 Jan;27(1):47-62.
doi: 10.1002/hbm.20166.

Method for multimodal analysis of independent source differences in schizophrenia: combining gray matter structural and auditory oddball functional data

Affiliations

Method for multimodal analysis of independent source differences in schizophrenia: combining gray matter structural and auditory oddball functional data

V D Calhoun et al. Hum Brain Mapp. 2006 Jan.

Abstract

The acquisition of both structural MRI (sMRI) and functional MRI (fMRI) data for a given study is a very common practice. However, these data are typically examined in separate analyses, rather than in a combined model. We propose a novel methodology to perform independent component analysis across image modalities, specifically, gray matter images and fMRI activation images as well as a joint histogram visualization technique. Joint independent component analysis (jICA) is used to decompose a matrix with a given row consisting of an fMRI activation image resulting from auditory oddball target stimuli and an sMRI gray matter segmentation image, collected from the same individual. We analyzed data collected on a group of schizophrenia patients and healthy controls using the jICA approach. Spatially independent joint-components are estimated and resulting components were further analyzed only if they showed a significant difference between patients and controls. The main finding was that group differences in bilateral parietal and frontal as well as posterior temporal regions in gray matter were associated with bilateral temporal regions activated by the auditory oddball target stimuli. A finding of less patient gray matter and less hemodynamic activity for target detection in these bilateral anterior temporal lobe regions was consistent with previous work. An unexpected corollary to this finding was that, in the regions showing the largest group differences, gray matter concentrations were larger in patients vs. controls, suggesting that more gray matter may be related to less functional connectivity in the auditory oddball fMRI task.


Figures

Figure 1
Figure 1
Model in which loading parameters are shared for the hidden feature/source. The feature matrix is organized by placing the features (SPM map and GM map) from the two modalities side by side. This matrix is then modeled as containing spatially independent joint source images which share common mixing matrix parameters.
Figure 2
Figure 2
Auditory oddball paradigm. Auditory oddball event‐related fMRI task.
Figure 3
Figure 3
Simulation and simulation results. Generation of hybrid data is depicted. Results from a lower and higher noise environment is shown in b,c. The source which revealed the greatest difference between the two “groups” is shown for the AOD part of the joint source (left, b,c) and the GM part of the joint source (middle, b,c). Loading parameters vs. the ground truth values are shown on the far right of b,c.
Figure 4
Figure 4
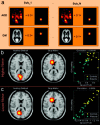
Auditory oddball/gray matter jICA analysis. Only one component demonstrated a significant difference between patients and controls. The joint source map for the auditory oddball (left) and gray matter (middle) data is presented along with the loading parameters for patients and controls (far right).
Figure 5
Figure 5
Separate ICA analyses of GM and AOD data. ICA was used to estimate components for each modality separately from the normalized data. The AOD (a) and GM (b) results were largely similar to the results found for the joint estimation. This gives us confidence that the assumptions made for the joint analysis are reasonable ones. c: The resulting spatial map if the mixing matrix from the separate AOD analysis (a) is regressed onto the GM data to generate the spatial map.
Figure 6
Figure 6
Cross‐modality 2‐D histograms. Joint 2‐D histograms for voxels identified in the jICA analysis. Individual (a) and group average difference (b) histograms are provided along with the marginal histograms for the auditory oddball (SPM contrast image) (c) and gray matter (segmented) (d) data. In the marginal histograms it is clear that controls (yellow) tend to have higher auditory oddball fMRI activation, whereas patients (cyan) tend to have higher gray matter values.
Figure 7
Figure 7
Auditory oddball/gray matter group difference maps. Standard SPM/VBM difference maps (controls minus patients) for the auditory oddball (left) and gray matter (right) data masked by the jICA‐GM regions (outlined in white) and the jICA‐AOD regions. Controls demonstrated more activation relative to patients in a variety of regions for the AOD tasks (consistent with previous findings) and demonstrated increased left DLPFC and decreased basal ganglia activation (also consistent with previous findings). The GM values are increased in controls for the jICA‐AOD regions and decreased for the jICA‐GM regions.
Figure 8
Figure 8
Average T1‐weighted images for healthy controls and patients with schizophrenia. The crosshair is positioned at the region showing largest gray matter increase in patients. This view clearly shows more gray matter in patients. [Color figure can be viewed in the online issue, which is available at www. interscience.wiley.com.]

References

    1. Alfano B, Amato U, Antoniadis A, Larobina M (2002): Segmentation of MR brain images through discriminant analysis. Italy: Report RT262/02. - PubMed
    1. Andreasen NC, Paradiso S, O'Leary DS (1998): “Cognitive dysmetria” as an integrative theory of schizophrenia: a dysfunction in cortical‐subcortical‐cerebellar circuitry? Schizophr Bull 24: 203–218. - PubMed
    1. Andreasen NC, Nopoulos P, O'Leary DS, Miller DD, Wassink T, Flaum M (1999): Defining the phenotype of schizophrenia: cognitive dysmetria and its neural mechanisms. Biol Psychiatry 46: 908–920. - PubMed
    1. Ashburner J, Friston KJ (2000): Voxel‐based morphometry—the methods. NeuroImage 11: 805–821. - PubMed
    1. Bell AJ, Sejnowski TJ (1995): An information maximisation approach to blind separation and blind deconvolution. Neural Comput 7: 1129–1159. - PubMed