. 2006 Apr;27(4):340-9.
doi: 10.1002/hbm.20189.

Motion standstill leads to activation of inferior parietal lobe

Affiliations

Motion standstill leads to activation of inferior parietal lobe

Andrea Federspiel et al. Hum Brain Mapp. 2006 Apr.

Abstract

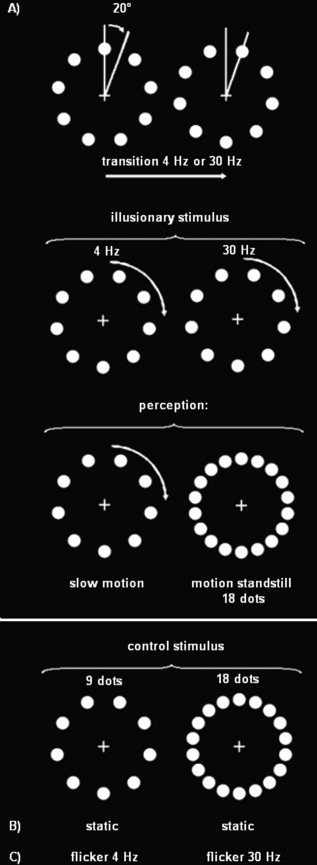
Previous studies on motion perception revealed motion-processing brain areas sensitive to changes in luminance and texture (low-level) and changes in salience (high-level). The present functional magnetic resonance imaging (fMRI) study focused on motion standstill. This phenomenon, occurring at fast presentation frequencies of visual moving objects that are perceived as static, has not been previously explored by neuroimaging techniques. Thirteen subjects were investigated while perceiving apparent motion at 4 Hz, at 30 Hz (motion standstill), isoluminant static and flickering stimuli, fixation cross, and blank screen, presented randomly and balanced for rapid event-related fMRI design. Blood oxygenation level-dependent (BOLD) signal in the occipito-temporal brain region MT/V5 increased during apparent motion perception. Here we could demonstrate that brain areas like the posterior part of the right inferior parietal lobule (IPL) demonstrated higher BOLD-signal during motion standstill. These findings suggest that the activation of higher-order motion areas is elicited by apparent motion at high presentation rates (motion standstill). We interpret this observation as a manifestation of an orienting reaction in IPL towards stimulus motion that might be detected but not resolved by other motion-processing areas (i.e., MT/V5).


Figures

Figure 1
Figure 1
Visual stimuli presented. A: Nine white dots (Ø 0.9°) arranged in a circle with radius of 10° on black background. Dots were alternating in position by a 20° shift. Illusionary stimuli used in the first and second experiments originated by an alternation rate of the 9 dots corresponding to 4 Hz (the illusionary perception is “slow motion”), or to 30 Hz (the illusionary perception is that of 18 dots “motion standstill”). B: Control categories in the first experiment were 9 static dots and 18 static dots. C: Control categories in the second experiment were 9 dots presented at flicker frequency of 4 Hz and 18 dots flickering at 30 Hz. Not shown in this schematic view are two categories that are displayed in each experiment: blank screen and fixation cross. Each stimulus category was presented 40 times: the resulting 240 stimuli were randomized and the stimulus categories were balanced.
Figure 2
Figure 2
Group GLM contrast analysis detects regions in which: (A) activity is higher during perception of visual stimuli than during fixation cross. Activation in the human early visual areas (Talairach coordinates: 7‐85 0); (B) activity is higher during perception of illusionary stimuli (both motion standstill and slow motion) than during “static” stimulation. Activation is observed bilateral in human motion complex MT/V5; (C) activity is higher during the perception of slow motion stimulus (4 Hz) as compared to static 9 dots stimulus in right human motion complex MT/V5; (D) activity is higher during the perception of motion standstill stimulus (30 Hz) as compared to static 18 dots stimulus. These regions corresponds to left MT/V5, left BA45 (gyrus frontalis inferior), right BA 44 (gyrus frontalis inferior), and bilaterally in the posterior part of BA 40 (inferior parietal lobe; gyrus supramarginal). Right top corner: color scale represents values of t‐test; significance level indicated (P(corrected) < 0.00001).
Figure 3
Figure 3
BOLD signal time course in cortical early visual areas averaged over 13 subjects. The region is shown in Figure 2A.
Figure 4
Figure 4
BOLD signal time course in cortical areas obtained as contrast between illusionary stimuli and “static” stimulation (a,b), and as contrast between motion standstill stimulus (30 Hz) and static 18 dots stimulus (c–f). Vertical scale: averaged percentage signal change; horizontal scale: stimulus onset time in seconds. Legends as well as scales are equal in all plots and only shown in a.
Figure 5
Figure 5
Second experiment: BOLD peak values (with standard deviation) for illusionary motion stimuli (motion standstill (black bars) and slow motion (dark gray bars) and for control stimuli (18 dots presented at flicker frequency of 30 Hz (white bars) and 9 dots presented at flicker frequency of 4 Hz (light gray bars). Vertical scale: averaged percentage signal change; horizontal scale: brain regions right IPL posterior, MT/V5 right and left and early visual areas.

References

    1. Aguirre GK, Zarahn E, D'Esposito M (1998): The variability of human, BOLD hemodynamic responses. Neuroimage 8: 360–369. - PubMed
    1. Bremmer F, Schlack A, Shah NJ, Zafiris O, Kubischik M, Hoffmann K, Zilles K, Fink GR (2001): Polymodal motion processing in posterior parietal and premotor cortex: a human fMRI study strongly implies equivalencies between humans and monkeys. Neuron 29: 287–296. - PubMed
    1. Cavanagh P (1992): Attention‐based motion perception. Science 257: 1563–1565. - PubMed
    1. Chawla D, Phillips J, Buechel C, Edwards R, Friston KJ (1998): Speed‐dependent motion‐sensitive responses in V5: an fMRI study. Neuroimage 7: 86–96. - PubMed
    1. Chawla D, Buechel C, Edwards R, Howseman A, Josephs O, Ashburner J, Friston KJ (1999): Speed‐dependent responses in V5: a replication study. Neuroimage 9: 508–515. - PubMed

Publication types

MeSH terms