

Cl- secretion in ATP-treated renal epithelial C7-MDCK cells is mediated by activation of P 2Y1 receptors, phospholipase A2 and protein kinase A
- PMID: 16109726
- PMCID: PMC1464179
- DOI: 10.1113/jphysiol.2005.094375
Cl- secretion in ATP-treated renal epithelial C7-MDCK cells is mediated by activation of P 2Y1 receptors, phospholipase A2 and protein kinase A
Abstract
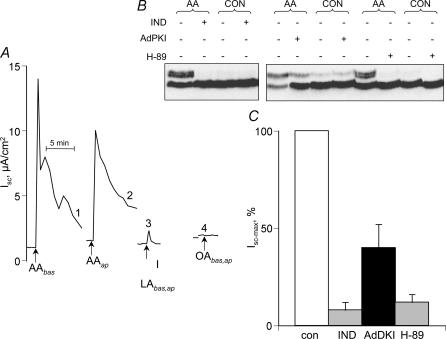
This study examines the mechanism of P 2Y-induced Cl- secretion in monolayers of C7-Madin-Darby canine kidney (MDCK) cells triggered by basolateral application of ATP and measured as transcellular short current (I(SC)). Both ATP-induced arachidonic acid (AA) synthesis and I(SC) in ATP-treated cells were abolished by the phosholipase A2 (PLA2) inhibitor, AACOCF3. The cyclo-oxygenase inhibitor indomethacin decreased I(SC) and cAMP production in ATP-treated cells with an IC50 of approximately 0.3 microm. ATP led to rapid activation of cAMP-dependent protein kinase A (PKA), as estimated by phosphorylation of a vasodilator-stimulated phosphoprotein. PKA activity and I(SC) evoked by ATP, as well as by prostaglandin E1 (PGE1), were diminished in the presence of the PKA inhibitor H-89 or an adenovirus-mediated expression of PKA-inhibitor protein, PKI. In contrast, indomethacin completely blocked the increment of PKA and I(SC) triggered by ATP and AA, but did not affect PKA activation and I(SC) detected with PGE1. The kinetics of [Ca2+]i elevation in ATP- and thapsigargin-treated cells were similar and suppressed by the Ca(2+)i chelator BAPTA. Neither baseline nor maximal increment of ATP-induced I(SC) was affected by thapsigargin and BAPTA. Real-time PCR showed that C7 cells express more mRNA for P 2Y1 and P 2Y2 than for other P 2Y receptor subtypes. The rank order of potency (2MeSATP > ATP > ADP >> UTP) indicates that P 2Y1 rather than P 2Y2 receptors contribute to PKA and I(SC) activation. Viewed collectively, these data show that Cl- secretion in C7-MDCK monolayers treated with basolateral ATP is triggered by P 2Y1 receptors and is mediated by subsequent [Ca2+]i-independent activation of PLA2 and PKA.
Figures


Similar articles
-
ATP-induced inhibition of Na+, K+, Cl- cotransport in Madin-Darby canine kidney cells: lack of involvement of known purinoceptor-coupled signaling pathways.J Membr Biol. 1999 Jan 15;167(2):193-204. doi: 10.1007/s002329900483. J Membr Biol. 1999. PMID: 9916150
-
Transient activation and delayed inhibition of Na+,K+,Cl- cotransport in ATP-treated C11-MDCK cells involve distinct P2Y receptor subtypes and signaling mechanisms.J Biol Chem. 2006 Oct 20;281(42):31317-25. doi: 10.1074/jbc.M602117200. Epub 2006 Aug 17. J Biol Chem. 2006. PMID: 16916802
-
Purinergic-induced ion current in monolayers of C7-MDCK cells: role of basolateral and apical ion transporters.J Membr Biol. 2002 Apr 1;186(3):131-43. doi: 10.1007/s00232-001-0141-y. J Membr Biol. 2002. PMID: 12148840
-
Dual role of protein kinase C in the regulation of cPLA2-mediated arachidonic acid release by P2U receptors in MDCK-D1 cells: involvement of MAP kinase-dependent and -independent pathways.J Clin Invest. 1997 Feb 15;99(4):805-14. doi: 10.1172/JCI119227. J Clin Invest. 1997. PMID: 9045886 Free PMC article.
-
Regulation of phospholipase A2 by receptors in MDCK-Dl cells.Biochem Soc Trans. 1991 Apr;19(2):329-33. doi: 10.1042/bst0190329. Biochem Soc Trans. 1991. PMID: 1653734 Review. No abstract available.
Cited by
-
Purinergic signalling in the kidney in health and disease.Purinergic Signal. 2014 Mar;10(1):71-101. doi: 10.1007/s11302-013-9400-5. Epub 2013 Nov 22. Purinergic Signal. 2014. PMID: 24265071 Free PMC article. Review.
-
Formation of cysts by principal-like MDCK cells depends on the synergy of cAMP- and ATP-mediated fluid secretion.J Mol Med (Berl). 2011 Mar;89(3):251-61. doi: 10.1007/s00109-010-0715-1. Epub 2011 Jan 5. J Mol Med (Berl). 2011. PMID: 21206992
-
Purinergic inhibition of Na⁺,K⁺,Cl⁻ cotransport in C11-MDCK cells: Role of stress-activated protein kinases.Purinergic Signal. 2008 Jun;4(2):183-91. doi: 10.1007/s11302-007-9057-z. Epub 2007 Jun 30. Purinergic Signal. 2008. PMID: 18368525 Free PMC article.
-
P2 receptors in renal pathophysiology.Purinergic Signal. 2009 Dec;5(4):513-20. doi: 10.1007/s11302-009-9153-3. Epub 2009 Jun 9. Purinergic Signal. 2009. PMID: 19507052 Free PMC article.
References
-
- Bourcier N, Grygorczyk R, Gekle M, Berthiaume Y, Orlov SN. Purinergic-induced ion current in monolayers of C7–MDCK cells: role of basolateral and apical ion transporters. J Membr Biol. 2002;186:131–143. - PubMed
-
- Breyer MD, Ando Y. Hormonal signaling and regulation of salt and water transport in the collecting duct. Annu Rev Physiol. 1994;56:711–739. - PubMed
-
- Brindikova TA, Bourcier N, Torres B, Pchejetski D, Gekle M, Maximov GV, Montminy V, Insel PA, Orlov SN, Isenring P. Purinergic-induced signaling in C11-MDCK cells inhibits the secretory Na-K-Cl cotransporter. Am J Physiol Cell Physiol. 2003;285:C1445–C1453. - PubMed
-
- Brown CDA, Simmons NL. Catecholamine-stimulation of Cl− secretion in MDCK cell epithelium. Biochim Biophys Acta. 1981;649:427–435. - PubMed
Publication types
MeSH terms
Substances
Grants and funding
LinkOut - more resources
Full Text Sources
Miscellaneous