. 2005 Sep;187(17):6119-27.
doi: 10.1128/JB.187.17.6119-6127.2005.

Exploring Lactobacillus plantarum genome diversity by using microarrays

Affiliations

Exploring Lactobacillus plantarum genome diversity by using microarrays

Douwe Molenaar et al. J Bacteriol. 2005 Sep.

Abstract

Lactobacillus plantarum is a versatile and flexible species that is encountered in a variety of niches and can utilize a broad range of fermentable carbon sources. To assess if this versatility is linked to a variable gene pool, microarrays containing a subset of small genomic fragments of L. plantarum strain WCFS1 were used to perform stringent genotyping of 20 strains of L. plantarum from various sources. The gene categories with the most genes conserved in all strains were those involved in biosynthesis or degradation of structural compounds like proteins, lipids, and DNA. Conversely, genes involved in sugar transport and catabolism were highly variable between strains. Moreover, besides the obvious regions of variance, like prophages, other regions varied between the strains, including regions encoding plantaricin biosynthesis, nonribosomal peptide biosynthesis, and exopolysaccharide biosynthesis. In many cases, these variable regions colocalized with regions of unusual base composition. Two large regions of flexibility were identified between 2.70 and 2.85 and 3.10 and 3.29 Mb of the WCFS1 chromosome, the latter being close to the origin of replication. The majority of genes encoded in these variable regions are involved in sugar metabolism. This functional overrepresentation and the unusual base composition of these regions led to the hypothesis that they represented lifestyle adaptation regions in L. plantarum. The present study consolidates this hypothesis by showing that there is a high degree of gene content variation among L. plantarum strains in genes located in these regions of the WCFS1 genome. Interestingly, based on our genotyping data L. plantarum strains clustered into two clearly distinguishable groups, which coincided with an earlier proposed subdivision of this species based on conventional methods.


Figures

FIG. 1.
FIG. 1.
A comparison of the gene contents of 20 strains of L. plantarum. The names of the strains tested are indicated to the left. For each strain, the gene content is indicated in a rectangle mapping onto the WCFS1 genome sequence. In these rectangles, the presence (no line) and absence (black line) of fragments is indicated. The upper rectangle, labeled “missing,” shows in black the fragments of the genome that were not spotted on the microarray (approximately 19% of the total chromosome). The panel labeled “sum of distances” shows the sum of distances over all strain combinations generated by the particular slice of the genome. It is a measure of the contribution of this slice to the total distance in the reconstructed phylogenetic tree and, thus, a measure of the genotypic variation mapping onto the slice. The lower panel shows the base deviation index along the chromosome of L. plantarum WCFS1. A high value of this index indicates an unusual base composition. The highest values are off scale in this panel. To the left, a tree is shown which represents a clustering of the strains that was based on a pairwise distance matrix derived from the results shown in the central panels. The distance metric used is described in Materials and Methods.
FIG. 2.
FIG. 2.
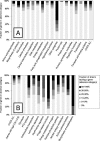
Conservation and variability of genes in L. plantarum GLp1, grouped according to functional classes. For each gene, the fraction of strains in which it was absent was determined and it was accordingly classified in an absence category. Subsequently, for each gene category the fraction of genes per absence category was plotted. Note that the “0% absence” category represents those genes that are conserved in all strains. Panel A shows the results for all main functional classes, whereas in panel B selected subcategories are shown that deviate significantly from the distribution of other subclasses in their main class. Also in panel B, the absence score for genes with a high CAI is shown.
FIG. 3.
FIG. 3.
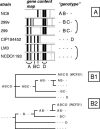
Demonstration of complex history of the 3.10- to 3.29-Mb lifestyle region. A region of the gene content maps, mapping on 3.10 to 3.29 Mb of the chromosome of WCFS1, is enlarged for a selection of strains (A). It is to be understood that the organization of genes in the maps does not necessarily represent the physical organization in the strains. Gene clusters (or combinations thereof) are labeled A to D, and the resulting “genotypes” are shown behind the maps, where a “−” stands for the absence of a cluster. Strains 299 and 299v or LM3 and NCDO 1193 have the same genotype and are grouped in panel B. Panel B shows putative clonal histories: one starting from a strain possessing all gene clusters (B1) and the other from a strain lacking all gene clusters (B2). These are only two examples of the many putative histories and are shown here to demonstrate that no clonal tree can be constructed without allowing for multiple independent gain or loss events for the same gene clusters in different ancestors. For example, in tree B1, A, B, and C are lost multiple times in different putative ancestors. The same is true for gain of C and D in tree B2.

References

    1. Adlerberth, I., S. Ahrné, M.-L. Johansson, G. Molin, L. Å. Hanson, and A. E. Wold. 1996. A mannose-specific adherence mechanism in Lactobacillus plantarum conferring binding to the human colonic cell line HT-29. Appl. Environ. Microbiol. 62:2244-2251. - PMC - PubMed
    1. Ahrne, S., S. Nobaek, B. Jeppsson, I. Adlerberth, A. E. Wold, and G. Molin. 1998. The normal Lactobacillus flora of healthy human rectal and oral mucosa. J. Appl. Microbiol. 85:88-94. - PubMed
    1. Aukrust, T., and H. Blom. 1992. Transformation of Lactobacillus strains used in meat and vegetable fermentations. Food Res. Int. 25:253-261.
    1. Aymerich, T., B. Martin, M. Garriga, and M. Hugas. 2003. Microbial quality and direct PCR identification of lactic acid bacteria and nonpathogenic staphylococci from artisanal low-acid sausages. Appl. Environ. Microbiol. 69:4583-4594. - PMC - PubMed
    1. Bateman, A., L. Coin, R. Durbin, R. D. Finn, V. Hollich, S. Griffiths-Jones, A. Khanna, M. Marshall, S. Moxon, E. L. Sonnhammer, D. J. Studholme, C. Yeats, and S. R. Eddy. 2004. The Pfam protein families database. Nucleic Acids Res. 32(Database issue):D138-D141. - PMC - PubMed

MeSH terms

LinkOut - more resources