. 2005 Sep;15(9):1265-73.
doi: 10.1101/gr.3198905. Epub 2005 Aug 18.

Genome-wide HP1 binding in Drosophila: developmental plasticity and genomic targeting signals

Affiliations

Genome-wide HP1 binding in Drosophila: developmental plasticity and genomic targeting signals

Elzo de Wit et al. Genome Res. 2005 Sep.

Abstract

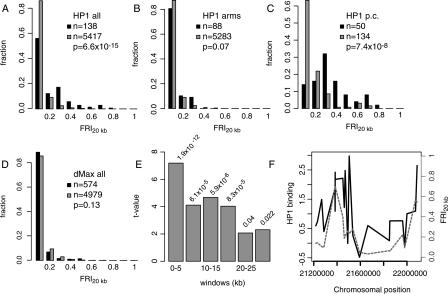
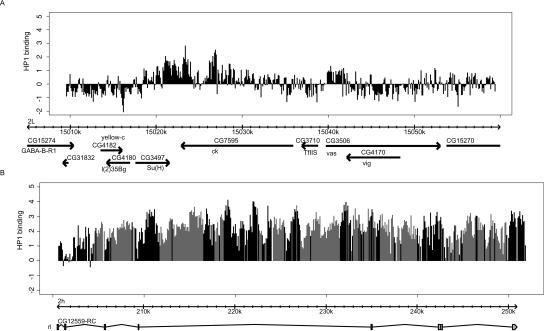
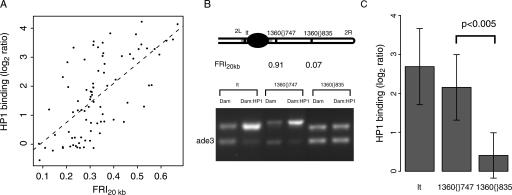
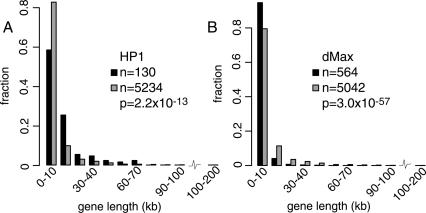
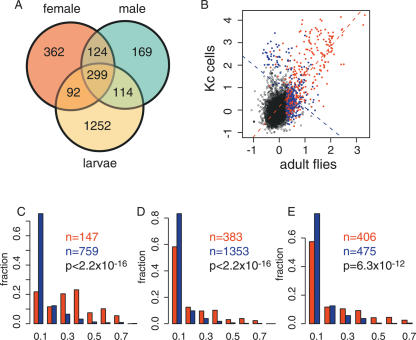
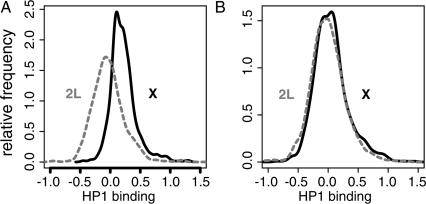
Heterochromatin protein 1 (HP1) is a major component of heterochromatin. It was reported to bind to a large number of genes and to many, but not all, transposable elements (TEs). The genomic signals responsible for targeting of HP1 have remained elusive. Here, we use whole-genome and computational approaches to identify genomic features that are predictive of HP1 binding in Drosophila melanogaster. We show that genes in repeat-dense regions are more likely to be bound by HP1, particularly in pericentric chromosomal regions. We also demonstrate that TEs are only bound by HP1 if they are flanked by other repeats, suggesting a cooperative mechanism of binding. Genome-wide DamID mapping of HP1 in larvae and adult flies reveals that repeat-flanked genes typically bind HP1 throughout development, whereas repeat-free genes display developmentally dynamic HP1 association. Furthermore, computational analysis shows that HP1 preferentially binds to transcribed regions of long genes. Finally, we detect low but significant amounts of HP1 along the entire X chromosome in male, but not female, flies, suggesting a link between HP1 and the dosage compensation complex. These results provide insights into the mechanisms of HP1 targeting in the natural genomic context.


Figures

Figure 1.
Figure 1.
Binding of HP1 and Su(var)3-9 to genes in pericentric regions is correlated with flanking repeats. (A-D) Histograms of the distributions in FRI20kb for single-copy target genes (black bars) and non-target genes (gray bars) of HP1 (A-C) and dMax (D). (A) All probed genes on the arms and in the pericentric regions; (B) genes on the chromosome arms only, i.e., non-pericentric genes; (C) pericentric genes only. P values in A-D were calculated using the Wilcoxon rank-sum test. (E) The t values for linear regression of HP1 binding vs. FRI for windows at various distances from the probe; corresponding P values are printed above each bar. (F) A detailed view of the pericentric region of chromosome 2L, with HP1 binding (solid line, log2 ratio) and the FRI20kb (dashed line) plotted for all probes in this region.
Figure 2.
Figure 2.
HP1 binding detected by genomic tiling arrays. Data from a tiling array with 60 nt probes every 100 bp (40-bp spacing). (A) HP1 binding in a region surrounding the ck gene. (B) HP1 binding to the rl locus in the pericentric region of chromosome 2. Black bars represent probes that are unique in the genome; gray bars represent probes that gave multiple BLAST results in the fly genome. The height of the bars represents the log2 ratio of HP1-binding (Dam-HP1 over Dam-only). The data has been normalized to the median of the log2 ratios of the probes in the 50-kb ck region.
Figure 3.
Figure 3.
HP1 binding to transposable elements is dependent on flanking repeats. (A) HP1 binding to TEs as a function of the FRI20kb. HP1 binding and FRI20kb for cDNAs on the array that contain sequences homologous to any of the consensus TE sequences (Kaminker et al. 2002) are plotted here. The dotted line shows the linear trendline through the data (Spearman rank correlation ρ = 0.62, P < 2.2 × 10⁻¹⁶). (B) Detection of HP1 binding by DamID and duplex PCR performed on two copies of the same transposable element (1360), both located on chromosome 2R, and the pericentric gene lt, a known target of HP1 (Greil et al. 2003). See Methods for a detailed description of the assay. The top bands correspond to the tested sequence, the bottom bands correspond to ade3, which does not bind HP1 (van Steensel and Henikoff 2000) and serves as an internal standard. (C) Quantitation of the HP1 status. Band intensities were quantified and normalized to the internal standard ade3. Average log2 ratios between Dam:HP1 and Dam reference were calculated for the two transposon copies (n = 5 and n = 6, respectively) and lt (n = 5). Difference between 1360{}747 and 1360{}835 is significant (P < 0.005, Student's t-test).
Figure 4.
Figure 4.
Gene-length distributions for targets and non-targets of HP1. Histograms of the distributions in gene length for target genes (black) and non-target genes (gray) for HP1 (A) and control protein dMax (B). Note that sample size is different from sample size in Figure 1 because it was not possible to obtain gene length information for every clone on the microarray.
Figure 5.
Figure 5.
Repetitive regions are associated with developmentally stable HP1 binding. (A) Venn diagram showing the number of overlapping and non-overlapping HP1 target genes in adult males, adult females, and female larvae. (B) Scatterplot of the binding log2 ratios of HP1 in whole adult flies versus HP1 binding in Kc cells. Colored circles indicate targets of HP1 either in adult flies or in Kc cells or in both. Blue circles indicate cDNAs that have an FRI20kb < 0.05, red circles are cDNAs that have an FRI20kb > 0.05. The broken lines are the regression lines through the blue and red data points. (C) The distributions of the FRI20kb for the genes that are bound by HP1 in both Kc cells and male adult flies (red) and for the genes that are bound by HP1 in either Kc cells or male adult flies, but not in both (blue). (D) The distributions of the FRI20kb for the genes that are bound by HP1 in both female larvae and in male adult flies (red) and for the genes that are bound by HP1 in either female larvae or male adult flies (blue). (E) The distributions of the FRI20kb for the genes that are bound by HP1 in both male and female adult flies (red) and for the genes that are bound by HP1 in either male or female adult flies, but not in both (blue).
Figure 6.
Figure 6.
HP1 binding is enriched at the male X chromosomes. Distribution of the HP1 binding levels of all probed genes on the X chromosome (solid line) and on chromosome 2L (dashed line) in adult males (A) and adult females (B).

Similar articles

Cited by

References

    1. Akhtar, A. 2003. Dosage compensation: An intertwined world of RNA and chromatin remodelling. Curr. Opin. Genet. Dev. 13: 161-169. - PubMed
    1. Altschul, S.F., Gish, W., Miller, W., Myers, E.W., and Lipman, D.J. 1990. Basic local alignment search tool. J. Mol. Biol. 215: 403-410. - PubMed
    1. Bannister, A.J., Zegerman, P., Partridge, J.F., Miska, E.A., Thomas, J.O., Allshire, R.C., and Kouzarides, T. 2001. Selective recognition of methylated lysine 9 on histone H3 by the HP1 chromo domain. Nature 410: 120-124. - PubMed
    1. Brand, A.H. and Perrimon, N. 1993. Targeted gene expression as a means of altering cell fates and generating dominant phenotypes. Development 118: 401-415. - PubMed
    1. Celniker, S.E., Wheeler, D.A., Kronmiller, B., Carlson, J.W., Halpern, A., Patel, S., Adams, M., Champe, M., Dugan, S.P., Frise, E., et al. 2002. Finishing a whole-genome shotgun: Release 3 of the Drosophila melanogaster euchromatic genome sequence. Genome Biol. 3: research0079. - PMC - PubMed

WEB SITE REFERENCES

    1. ftp://flybase.net/genomes/Drosophila_melanogaster/dmel_RELEASE3-1/GFF/wh...; Annotation files from Flybase.
    1. http://www.fruitfly.org/p_disrupt/datasets/NATURAL_TRANSPOSABLE_ELEMENTS.fa; Sequences of transposable elements of D. melanogaster.
    1. http://www.r-project.org; R software package for statistical analysis.
    1. http://www.ensembl.org; Ensembl genome database.

Publication types

LinkOut - more resources