

Origin and evolution of new exons in rodents
- PMID: 16109974
- PMCID: PMC1199540
- DOI: 10.1101/gr.3929705
Origin and evolution of new exons in rodents
Abstract
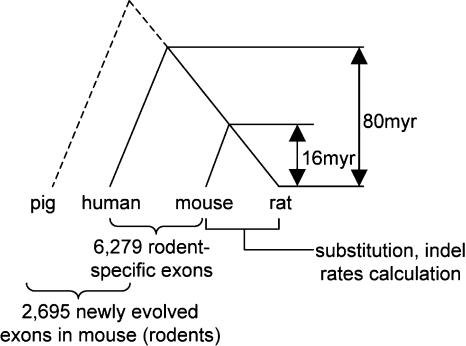
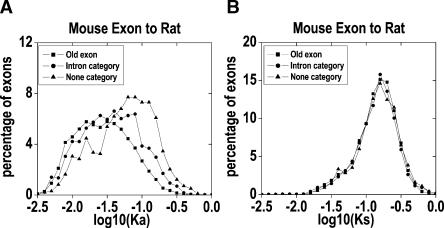
Gene number difference among organisms demonstrates that new gene origination is a fundamental biological process in evolution. Exon shuffling has been universally observed in the formation of new genes. Yet to be learned are the ways new exons originate and evolve, and how often new exons appear. To address these questions, we identified 2695 newly evolved exons in the mouse and rat by comparing the expressed sequences of 12,419 orthologous genes between human and mouse, using 743,856 pig ESTs as the outgroup. The new exon origination rate is about 2.71 x 10(-3) per gene per million years. These new exons have markedly accelerated rates both of nonsynonymous substitutions and of insertions/deletions (indels). A much higher proportion of new exons have K(a)/K(s) ratios >1 (where K(a) is the nonsynonymous substitution rate and K(s) is the synonymous substitution rate) than do the old exons shared by human and mouse, implying a role of positive selection in the rapid evolution. The majority of these new exons have sequences unique in the genome, suggesting that most new exons might originate through "exonization" of intronic sequences. Most of the new exons appear to be alternative exons that are expressed at low levels.
Figures
References
WEB SITE REFERENCES
-
- ftp://ftp.ncbi.nih.gov/pub/HomoloGene/; HomoloGene database for human-mouse orthologous genes in RefSeq format.
-
- ftp://ftp.ncbi.nih.gov/repository/UniGene/; the human and mouse mRNA/EST data.
-
- http://genome.ucsc.edu/goldenPath/10april2003/database/; human UniGene database.
-
- http://genome.ucsc.edu/goldenPath/mmFeb2003/database/; mouse UniGene database.
-
- http://genome.ucsc.edu/goldenPath/mmFeb2003/alignments/vsRn2/axtBest/; Mouse-rat genome alignment from UCSC.
Publication types
MeSH terms
Substances
LinkOut - more resources
Full Text Sources
Other Literature Sources