

Stepwise length changes in single invertebrate thick filaments
- PMID: 16113114
- PMCID: PMC1366822
- DOI: 10.1529/biophysj.105.069864
Stepwise length changes in single invertebrate thick filaments
Abstract
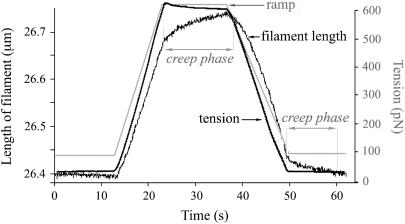
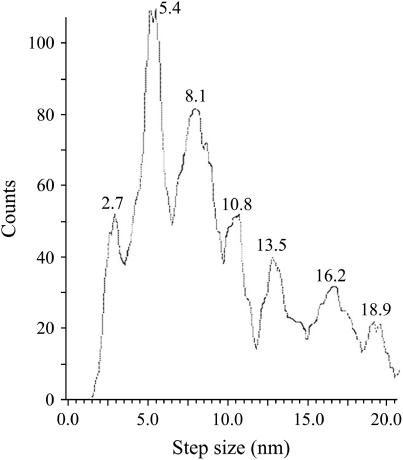
Previous experiments on thick filaments of the anterior byssus retractor muscle of Mytilus and the telson-levator muscle of Limulus polyphemus have shown large, reversible length changes up to 23% and 66% of initial length, respectively, within the physiological tension range. Using nanofabricated cantilevers and newly developed high-resolution detection methods, we investigated the dynamics of isolated Mytilus anterior byssus retractor muscle thick filaments. Single thick filaments were suspended between the tips of two microbeams oriented perpendicular to the filament axis: a deflectable cantilever and a stationary beam. Axial stress was applied by translating the base of the deflectable nanolever away from the stationary beam, which bent the nanolever. Tips of flexible nanolevers and stationary beam were imaged onto a photodiode array to track their positions. Filament shortening and lengthening traces, obtained immediately after the motor had imposed stress on the filament, showed steps and pauses. Step sizes were 2.7 nm and integer multiples thereof. Steps of this same size paradigm have been seen both during contraction of single sarcomeres and during active interaction between single isolated actin and myosin filaments, raising the question whether all of these phenomena might be related.
Figures


Similar articles
-
Elastic properties of isolated thick filaments measured by nanofabricated cantilevers.Biophys J. 1998 Aug;75(2):938-47. doi: 10.1016/S0006-3495(98)77582-4. Biophys J. 1998. PMID: 9675194 Free PMC article.
-
X-ray diffraction evidence for the extensibility of actin and myosin filaments during muscle contraction.Biophys J. 1994 Dec;67(6):2422-35. doi: 10.1016/S0006-3495(94)80729-5. Biophys J. 1994. PMID: 7779179 Free PMC article.
-
Translation step size measured in single sarcomeres and single filament pairs.Adv Exp Med Biol. 2003;538:129-40; discussion 141. doi: 10.1007/978-1-4419-9029-7_12. Adv Exp Med Biol. 2003. PMID: 15098661 No abstract available.
-
Ultrastructure of invertebrate muscle cell types.Histol Histopathol. 1996 Jan;11(1):181-201. Histol Histopathol. 1996. PMID: 8720463 Review.
-
Mechanics and models of the myosin motor.Philos Trans R Soc Lond B Biol Sci. 2000 Apr 29;355(1396):433-40. doi: 10.1098/rstb.2000.0584. Philos Trans R Soc Lond B Biol Sci. 2000. PMID: 10836496 Free PMC article. Review.
Cited by
-
Emergent spatiotemporal dynamics of the actomyosin network in the presence of chemical gradients.Integr Biol (Camb). 2019 Jun 1;11(6):280-292. doi: 10.1093/intbio/zyz023. Integr Biol (Camb). 2019. PMID: 31365063 Free PMC article.
-
Emergent mechanics of actomyosin drive punctuated contractions and shape network morphology in the cell cortex.PLoS Comput Biol. 2018 Sep 17;14(9):e1006344. doi: 10.1371/journal.pcbi.1006344. eCollection 2018 Sep. PLoS Comput Biol. 2018. PMID: 30222728 Free PMC article.
-
Comparative biomechanics of thick filaments and thin filaments with functional consequences for muscle contraction.J Biomed Biotechnol. 2010;2010:473423. doi: 10.1155/2010/473423. Epub 2010 Jun 6. J Biomed Biotechnol. 2010. PMID: 20625489 Free PMC article. Review.
-
Rotational model for actin filament alignment by myosin.J Theor Biol. 2012 May 7;300:344-59. doi: 10.1016/j.jtbi.2012.01.036. Epub 2012 Feb 5. J Theor Biol. 2012. PMID: 22326473 Free PMC article.
-
Contraction-Induced Changes in Hydrogen Bonding of Muscle Hydration Water.J Phys Chem Lett. 2014 Mar 20;5(6):947-952. doi: 10.1021/jz5000879. Epub 2014 Feb 25. J Phys Chem Lett. 2014. PMID: 24803993 Free PMC article.
References
-
- Kellermayer, M. S., S. B. Smith, H. L. Granzier, and C. Bustamante. 1997. Folding-unfolding transitions in single titin molecules characterized with laser tweezers. Science. 276:1112–1116. Erratum appears in Science. 1997. 277:1117. - PubMed
-
- Rief, M., M. Gautel, F. Oesterhelt, J. M. Fernandez, and H. E. Gaub. 1997. Reversible unfolding of individual titin immunoglobulin domains by AFM. Science. 276:1109–1112. - PubMed
-
- Tskhovrebova, L., J. Trinick, J. A. Sleep, and R. M. Simmons. 1997. Elasticity and unfolding of single molecules of the giant muscle protein titin. Nature. 387:308–312. - PubMed
MeSH terms
Substances
LinkOut - more resources
Full Text Sources
