

Temperature dependence and thermodynamic properties of Ca2+ sparks in rat cardiomyocytes
- PMID: 16113119
- PMCID: PMC1366752
- DOI: 10.1529/biophysj.105.067074
Temperature dependence and thermodynamic properties of Ca2+ sparks in rat cardiomyocytes
Abstract
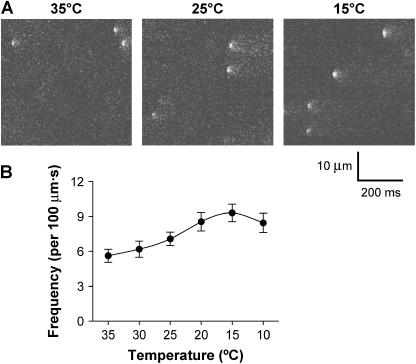
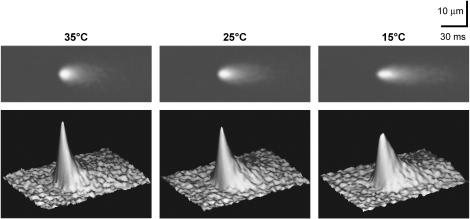
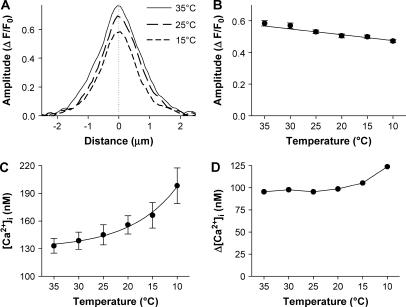
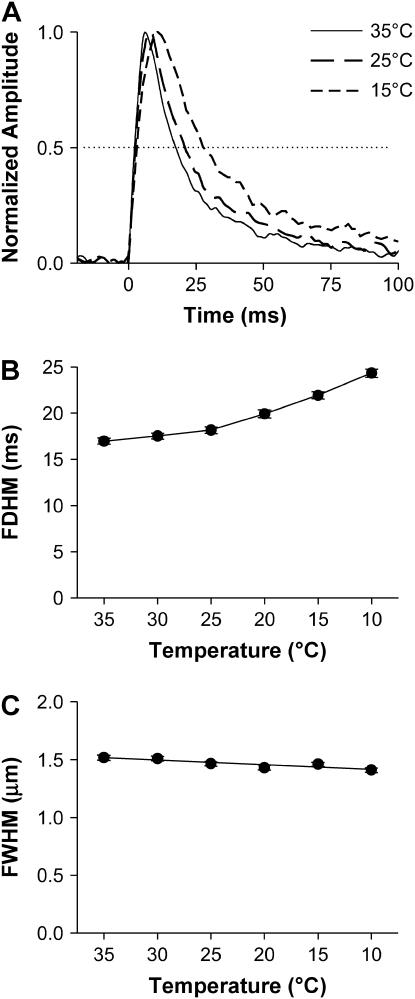
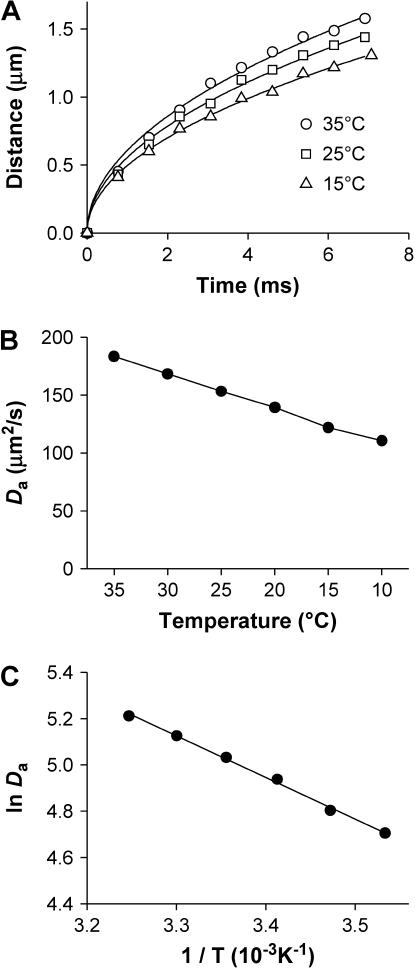
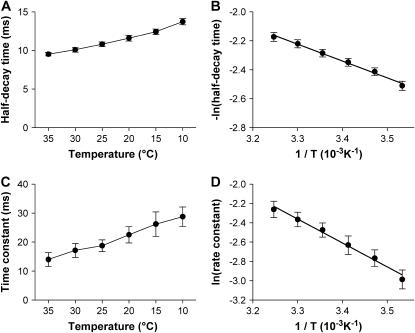
To elucidate the temperature dependence and underlying thermodynamic determinants of the elementary Ca2+ release from the sarcoplasmic reticulum, we characterized Ca2+ sparks originating from ryanodine receptors (RyRs) in rat cardiomyocytes over a wide range of temperature. From 35 degrees C to 10 degrees C, the normalized fluo-3 fluorescence of Ca2+ sparks decreased monotonically, but the Delta[Ca2+]i were relatively unchanged due to increased resting [Ca2+]i. The time-to-peak of Ca2+ sparks, which represents the RyR Ca2+ release duration, was prolonged by 37% from 35 degrees C to 10 degrees C. An Arrhenius plot of the data identified a jump of apparent activation energy from 5.2 to 14.6 kJ/mol at 24.8 degrees C, which presumably reflects a transition of sarcoplasmic reticulum lipids. Thermodynamic analysis of the decay kinetics showed that active transport plays little role in early recovery but a significant role in late recovery of local Ca2+ concentration. These results provided a basis for quantitative interpretation of intracellular Ca2+ signaling under various thermal conditions. The relative temperature insensitivity above the transitional 25 degrees C led to the notion that Ca2+ sparks measured at a "warm room" temperature are basically acceptable in elucidating mammalian heart function.
Figures

Similar articles
-
Regional differences in spontaneous Ca2+ spark activity and regulation in cat atrial myocytes.J Physiol. 2006 May 1;572(Pt 3):799-809. doi: 10.1113/jphysiol.2005.103267. J Physiol. 2006. PMID: 16484302 Free PMC article.
-
Effect of osmotic stress on spontaneous calcium sparks in rat ventricular myocytes.Acta Pharmacol Sin. 2006 Jul;27(7):877-87. doi: 10.1111/j.1745-7254.2006.00371.x. Acta Pharmacol Sin. 2006. PMID: 16787572
-
Ca2+/calmodulin kinase II-dependent phosphorylation of ryanodine receptors suppresses Ca2+ sparks and Ca2+ waves in cardiac myocytes.Circ Res. 2007 Feb 16;100(3):399-407. doi: 10.1161/01.RES.0000258022.13090.55. Epub 2007 Jan 18. Circ Res. 2007. PMID: 17234969
-
Ca2+ sparks in skeletal muscle.Prog Biophys Mol Biol. 2006 Nov;92(3):308-32. doi: 10.1016/j.pbiomolbio.2005.05.016. Epub 2005 Jul 1. Prog Biophys Mol Biol. 2006. PMID: 16125755 Review.
-
Ca2+ channels, ryanodine receptors and Ca(2+)-activated K+ channels: a functional unit for regulating arterial tone.Acta Physiol Scand. 1998 Dec;164(4):577-87. doi: 10.1046/j.1365-201X.1998.00462.x. Acta Physiol Scand. 1998. PMID: 9887980 Review.
Cited by
-
Interaction between neuronal nitric oxide synthase signaling and temperature influences sarcoplasmic reticulum calcium leak: role of nitroso-redox balance.Circ Res. 2015 Jan 2;116(1):46-55. doi: 10.1161/CIRCRESAHA.116.305172. Epub 2014 Oct 17. Circ Res. 2015. PMID: 25326127 Free PMC article.
-
Beta-adrenergic signaling accelerates and synchronizes cardiac ryanodine receptor response to a single L-type Ca2+ channel.Proc Natl Acad Sci U S A. 2009 Oct 20;106(42):18028-33. doi: 10.1073/pnas.0906560106. Epub 2009 Oct 7. Proc Natl Acad Sci U S A. 2009. PMID: 19815510 Free PMC article.
-
Dynamic interreceptor coupling contributes to the consistent open duration of ryanodine receptors.Biophys J. 2009 Jun 17;96(12):4826-33. doi: 10.1016/j.bpj.2009.03.042. Biophys J. 2009. PMID: 19527642 Free PMC article.
-
Calcium waves initiating from the anomalous subdiffusive calcium sparks.J R Soc Interface. 2013 Dec 11;11(91):20130934. doi: 10.1098/rsif.2013.0934. Print 2014 Feb 6. J R Soc Interface. 2013. PMID: 24335558 Free PMC article.
-
Ca2+ cycling in heart cells from ground squirrels: adaptive strategies for intracellular Ca2+ homeostasis.PLoS One. 2011;6(9):e24787. doi: 10.1371/journal.pone.0024787. Epub 2011 Sep 14. PLoS One. 2011. PMID: 21935466 Free PMC article.
References
-
- Bers, D. M. 2001. Excitation-Contraction Coupling and Cardiac Contractile Force, 2nd ed. Kluwer Academic Publishers, Dordrecht, The Netherlands.
-
- Berridge, M. J., M. D. Bootman, and H. L. Roderick. 2003. Calcium signalling: dynamics, homeostasis and remodelling. Nat. Rev. Mol. Cell Biol. 4:517–529. - PubMed
-
- Cheng, H., W. J. Lederer, and M. B. Cannell. 1993. Calcium sparks: elementary events underlying excitation-contraction coupling in heart muscle. Science. 262:740–744. - PubMed
-
- Tsugorka, A., E. Rios, and L. A. Blatter. 1995. Imaging elementary events of calcium release in skeletal muscle cells. Science. 269:1723–1726. - PubMed
Publication types
MeSH terms
Substances
LinkOut - more resources
Full Text Sources
Miscellaneous
