

Cosuppression of eukaryotic release factor 1-1 in Arabidopsis affects cell elongation and radial cell division
- PMID: 16113224
- PMCID: PMC1203362
- DOI: 10.1104/pp.105.062695
Cosuppression of eukaryotic release factor 1-1 in Arabidopsis affects cell elongation and radial cell division
Abstract
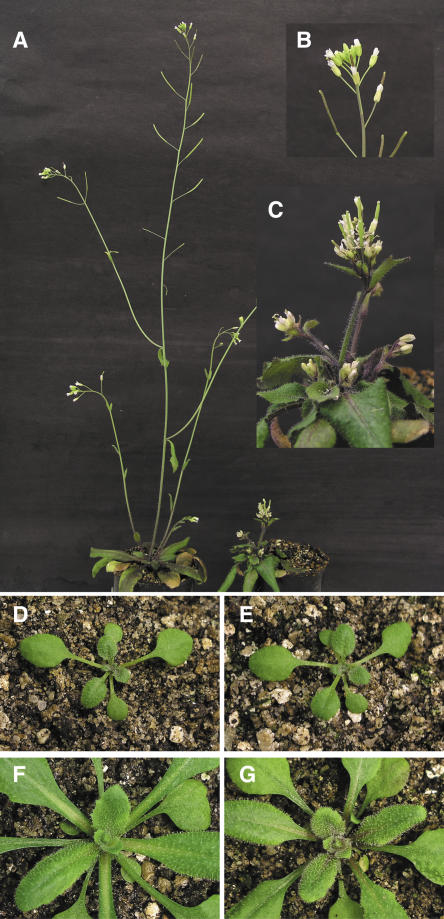
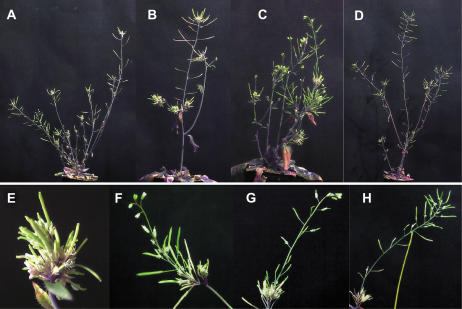
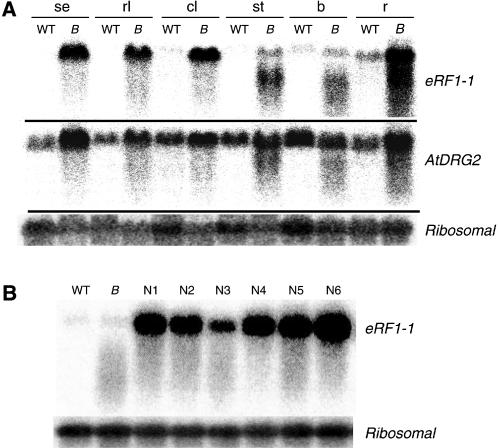
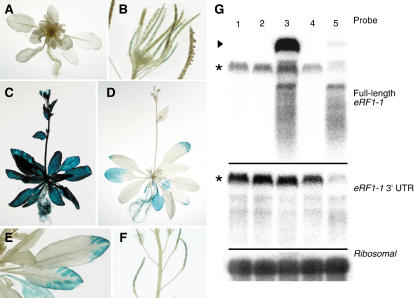
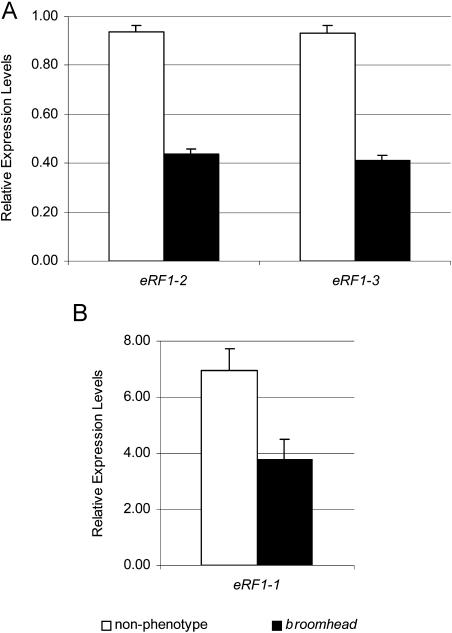
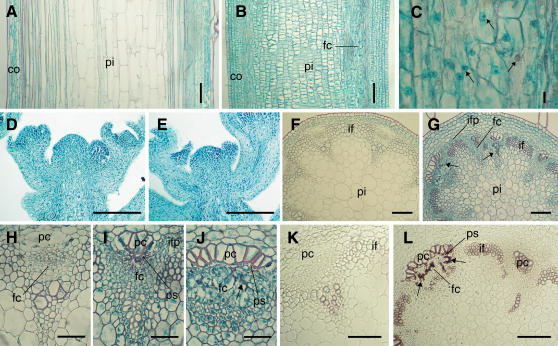
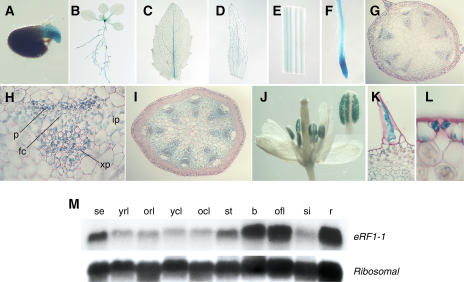
The role of the eukaryotic release factor 1 (eRF1) in translation termination has previously been established in yeast; however, only limited characterization has been performed on any plant homologs. Here, we demonstrate that cosuppression of eRF1-1 in Arabidopsis (Arabidopsis thaliana) has a profound effect on plant morphology, resulting in what we term the broomhead phenotype. These plants primarily exhibit a reduction in internode elongation causing the formation of a broomhead-like cluster of malformed siliques at the top of the inflorescence stem. Histological analysis of broomhead stems revealed that cells are reduced in height and display ectopic lignification of the phloem cap cells, some phloem sieve cells, and regions of the fascicular cambium, as well as enhanced lignification of the interfascicular fibers. We also show that cell division in the fascicular cambial regions is altered, with the majority of vascular bundles containing cambial cells that are disorganized and possess enlarged nuclei. This is the first attempt at functional characterization of a release factor in vivo in plants and demonstrates the importance of eRF1-1 function in Arabidopsis.
Figures
Similar articles
-
Expression of the eRF1 translation termination factor is controlled by an autoregulatory circuit involving readthrough and nonsense-mediated decay in plants.Nucleic Acids Res. 2017 Apr 20;45(7):4174-4188. doi: 10.1093/nar/gkw1303. Nucleic Acids Res. 2017. PMID: 28062855 Free PMC article.
-
Dof5.6/HCA2, a Dof transcription factor gene, regulates interfascicular cambium formation and vascular tissue development in Arabidopsis.Plant Cell. 2009 Nov;21(11):3518-34. doi: 10.1105/tpc.108.064139. Epub 2009 Nov 13. Plant Cell. 2009. PMID: 19915089 Free PMC article.
-
hca: an Arabidopsis mutant exhibiting unusual cambial activity and altered vascular patterning.Plant J. 2005 Oct;44(2):271-89. doi: 10.1111/j.1365-313X.2005.02526.x. Plant J. 2005. PMID: 16212606
-
Activation tagging of Arabidopsis POLYGALACTURONASE INVOLVED IN EXPANSION2 promotes hypocotyl elongation, leaf expansion, stem lignification, mechanical stiffening, and lodging.Plant J. 2017 Mar;89(6):1159-1173. doi: 10.1111/tpj.13453. Epub 2017 Feb 11. Plant J. 2017. PMID: 28004869
-
Overexpression of EVE1, a novel ubiquitin family protein, arrests inflorescence stem development in Arabidopsis.J Exp Bot. 2011 Aug;62(13):4571-81. doi: 10.1093/jxb/err168. Epub 2011 May 30. J Exp Bot. 2011. PMID: 21624980 Free PMC article.
Cited by
-
The role of translation termination factor eRF1 in the regulation of pseudohyphal growth in Saccharomyces cerevisiae cells.Dokl Biochem Biophys. 2010 Jul-Aug;433:209-11. doi: 10.1134/S1607672910040162. Epub 2010 Aug 17. Dokl Biochem Biophys. 2010. PMID: 20714858 No abstract available.
-
Ggamma1 + Ggamma2 not equal to Gbeta: heterotrimeric G protein Ggamma-deficient mutants do not recapitulate all phenotypes of Gbeta-deficient mutants.Plant Physiol. 2008 Jun;147(2):636-49. doi: 10.1104/pp.108.117655. Epub 2008 Apr 25. Plant Physiol. 2008. PMID: 18441222 Free PMC article.
-
Reduced Biosynthesis of Digalactosyldiacylglycerol, a Major Chloroplast Membrane Lipid, Leads to Oxylipin Overproduction and Phloem Cap Lignification in Arabidopsis.Plant Cell. 2016 Jan;28(1):219-32. doi: 10.1105/tpc.15.01002. Epub 2015 Dec 31. Plant Cell. 2016. PMID: 26721860 Free PMC article.
-
Eukaryotic release factor 1-2 affects Arabidopsis responses to glucose and phytohormones during germination and early seedling development.J Exp Bot. 2010;61(2):357-67. doi: 10.1093/jxb/erp308. Epub 2009 Nov 25. J Exp Bot. 2010. PMID: 19939886 Free PMC article.
-
Analysis of the Aging-Related AP2/ERF Transcription Factor Gene Family in Osmanthus fragrans.Int J Mol Sci. 2024 Jul 23;25(15):8025. doi: 10.3390/ijms25158025. Int J Mol Sci. 2024. PMID: 39125596 Free PMC article.
References
-
- Altamura MM, Possenti M, Matteucci A, Baima S, Ruberti I, Morelli G (2001) Development of the vascular system in the inflorescence stem of Arabidopsis. New Phytol 151: 381–389
-
- Arioli T, Peng L, Betzner AS, Burn J, Wittke W, Herth W, Camilleri C, Höfte H, Plazinski J, Birch R, et al (1998) Molecular analysis of cellulose biosynthesis in Arabidopsis. Science 279: 717–720 - PubMed
-
- Borchsenius AS, Tchourikova AA, Inge-Vechtomov SG (2000) Recessive mutations in SUP35 and SUP45 genes coding for translation release factors affect chromosome stability in Saccharomyces cerevisiae. Curr Genet 37: 285–291 - PubMed
-
- Borkhsenius AS, Inge-Vechtomov SG (1997) The role of SUP35 and SUP45 genes in controlling Saccharomyces cell cycle. Dokl Akad Nauk 353: 553–556 - PubMed
MeSH terms
Substances
LinkOut - more resources
Full Text Sources
Other Literature Sources
Molecular Biology Databases
Miscellaneous
