

En face optical coherence tomography: a new method to analyse structural changes of the optic nerve head in rat glaucoma
- PMID: 16113384
- PMCID: PMC1772813
- DOI: 10.1136/bjo.2004.058941
En face optical coherence tomography: a new method to analyse structural changes of the optic nerve head in rat glaucoma
Erratum in
- Br J Ophthalmol. 2005 Nov;89(11):1545. Podolean, AG [corrected to Podoleanu, AG]
Abstract
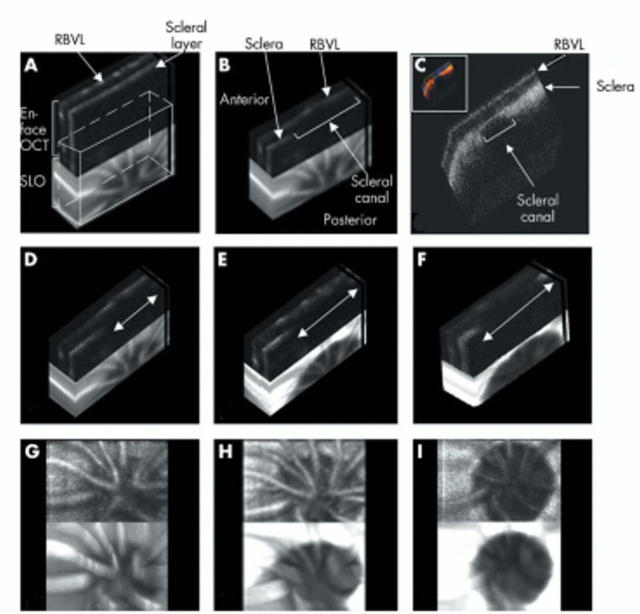
Aim: To investigate en face optical coherence tomography (eOCT) and its use as an effective objective technique for assessing changes in the glaucomatous rat optic nerve head (ONH) in vivo, and compare it with confocal scanning laser ophthalmoscopy (cSLO).
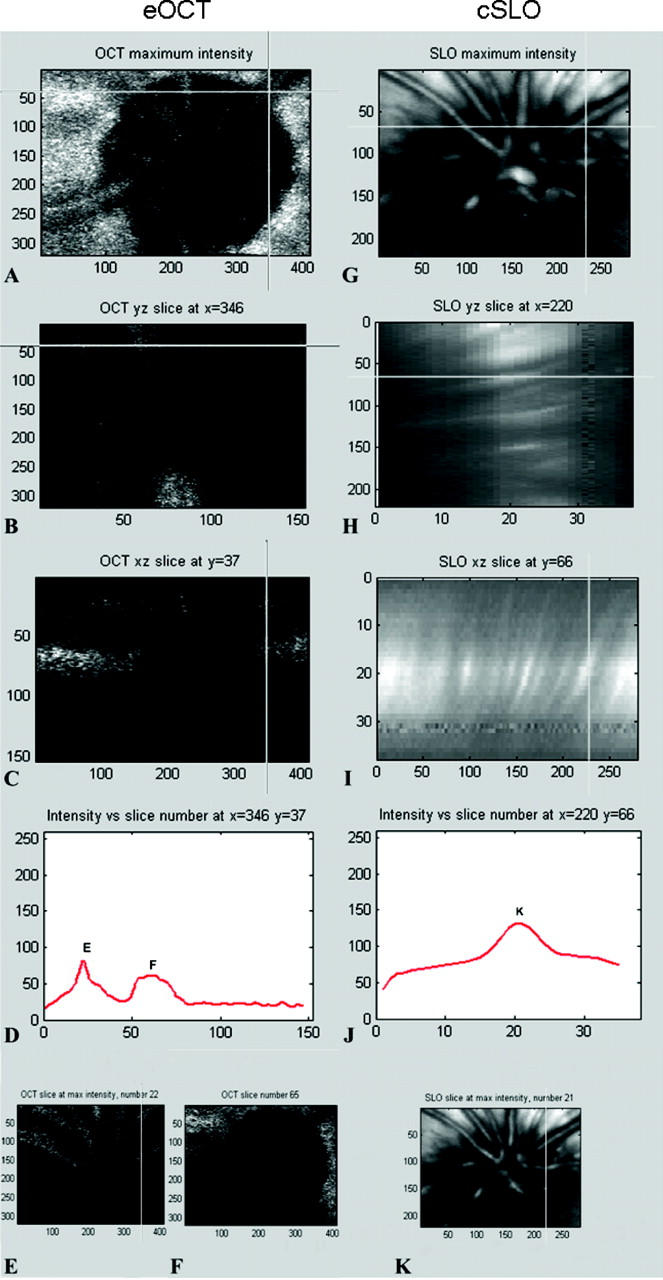
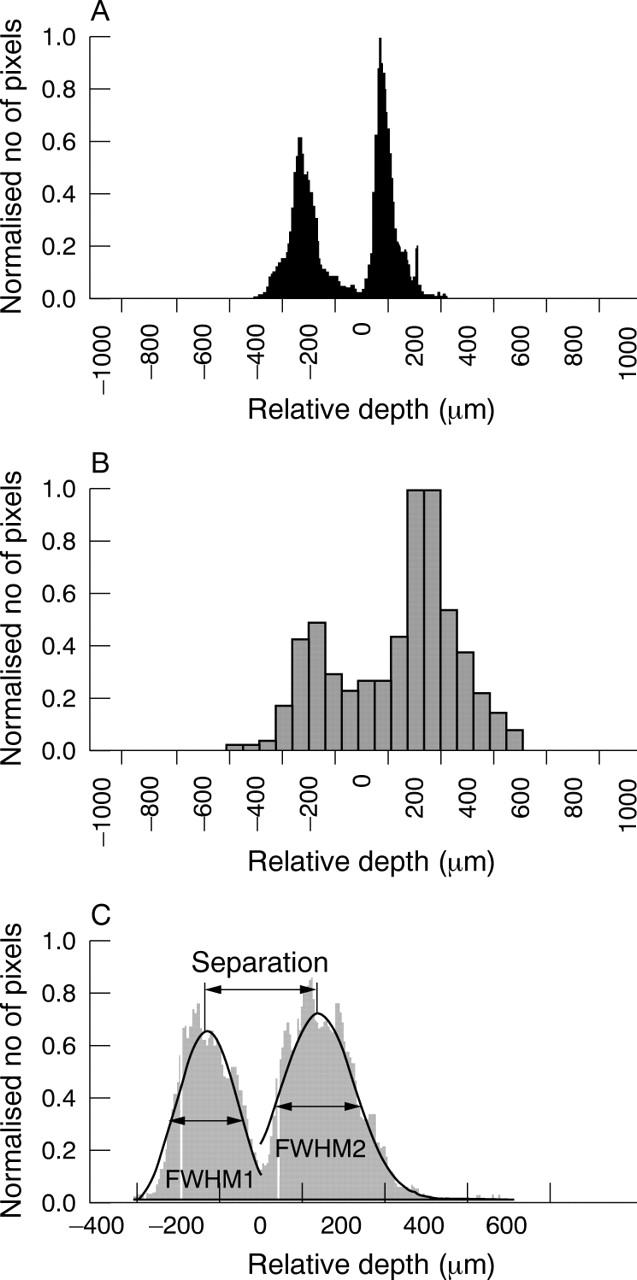
Methods: 18 Dark Agouti (DA) rats with surgically induced ocular hypertension were imaged with eOCT and cSLO at regular intervals. Assessment included three dimensional (3D) topographic reconstructions, intensity z-profile plots, a new method of depth analysis to define a "multilayered" structure, and scleral canal measurements, in relation to the degree of intraocular pressure (IOP) exposure.
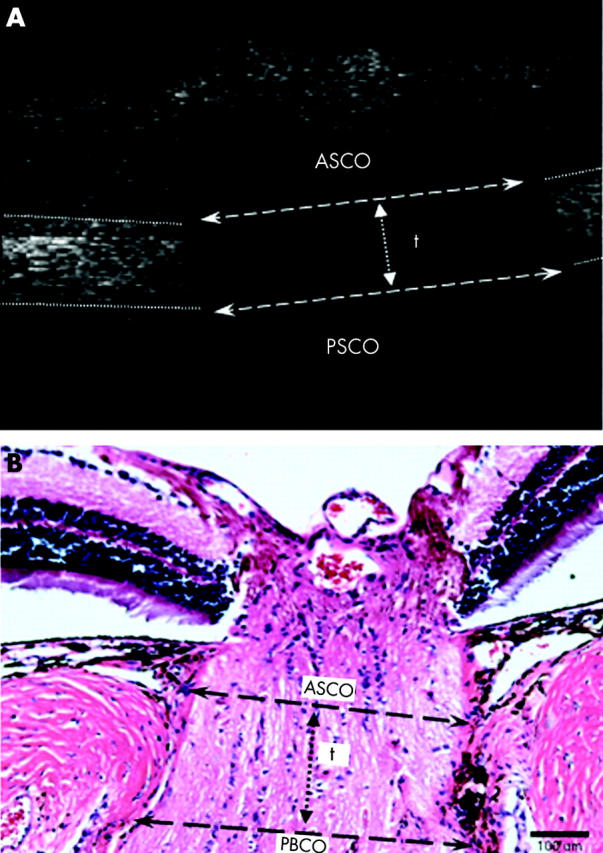
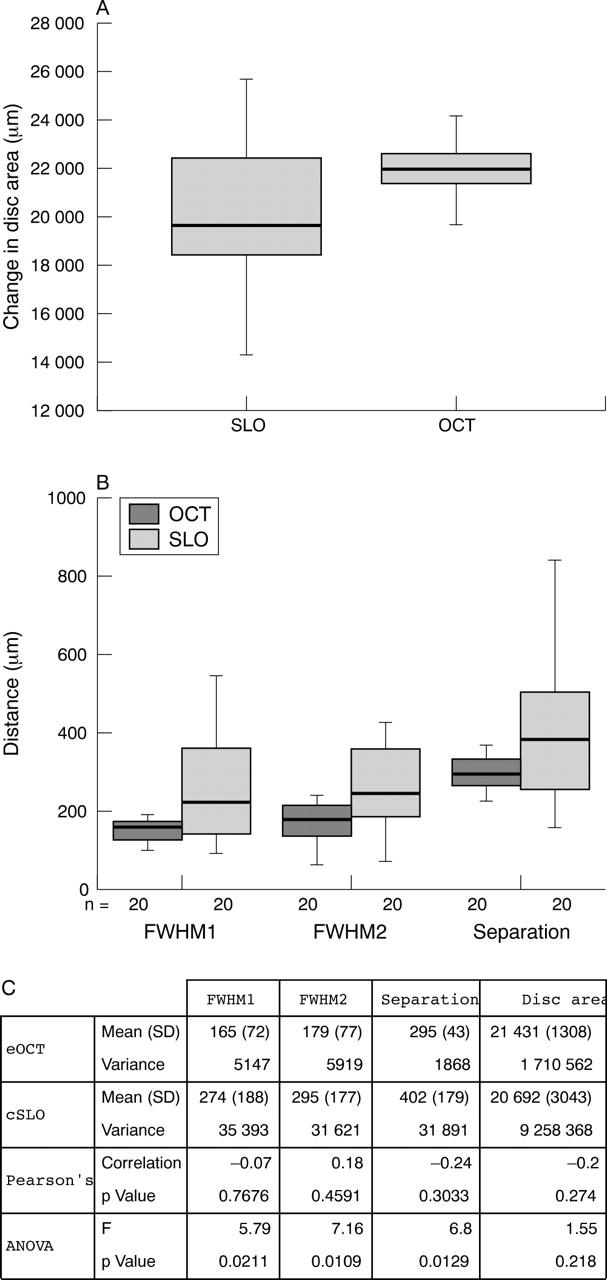
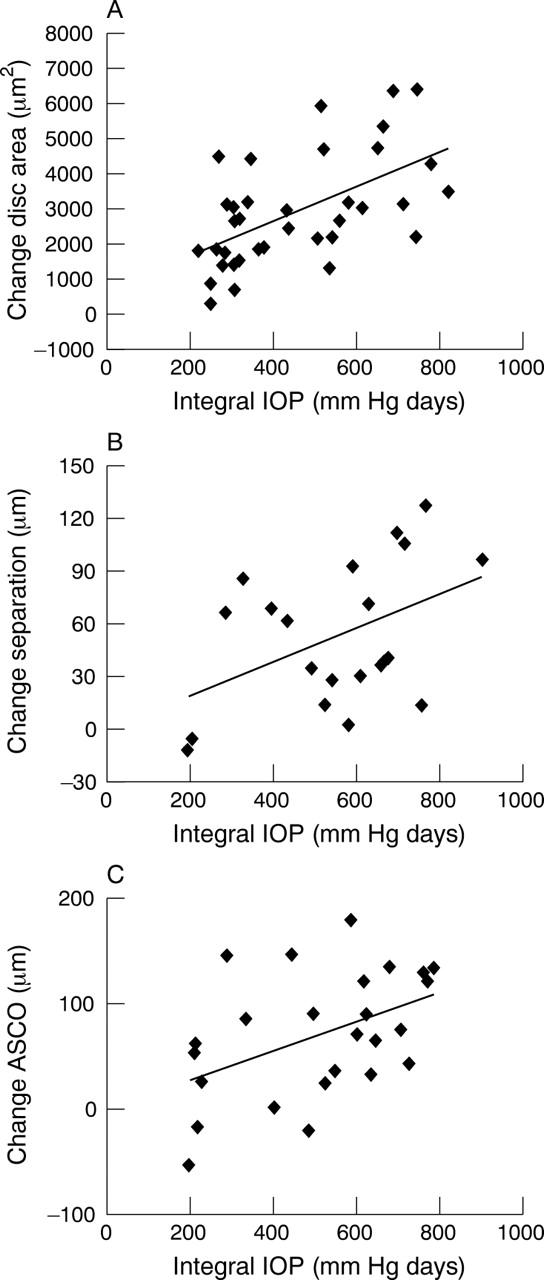
Results: The increased depth resolution of the eOCT compared to the cSLO was apparent in all methods of analysis, with better discrimination of tissue planes. This was validated histologically. eOCT demonstrated several significant changes in imaged rat ONH which correlated with IOP exposure, including the area of ONH (p<0.01), separation between retinal vessel and scleral layers (p<0.05), and anterior scleral canal opening expansion (p<0.05).
Conclusion: eOCT appears to be effective in assessing rat ONH, allowing detailed structural analysis of the multilayered ONH structure. As far as the authors are aware, this is the first report of scleral canal expansion in a rat model. They suggest eOCT as a novel method for the detection of early changes in the ONH in glaucoma.
Figures
Similar articles
-
Optic nerve head deformation in glaucoma: the temporal relationship between optic nerve head surface depression and retinal nerve fiber layer thinning.Ophthalmology. 2014 Dec;121(12):2362-70. doi: 10.1016/j.ophtha.2014.06.035. Epub 2014 Aug 6. Ophthalmology. 2014. PMID: 25108319
-
Expansions of the neurovascular scleral canal and contained optic nerve occur early in the hypertonic saline rat experimental glaucoma model.Exp Eye Res. 2016 Apr;145:173-186. doi: 10.1016/j.exer.2015.10.014. Epub 2015 Oct 22. Exp Eye Res. 2016. PMID: 26500195 Free PMC article.
-
Alterations in the neural and connective tissue components of glaucomatous cupping after glaucoma surgery using swept-source optical coherence tomography.Invest Ophthalmol Vis Sci. 2014 Jan 23;55(1):477-84. doi: 10.1167/iovs.13-11897. Invest Ophthalmol Vis Sci. 2014. PMID: 24398100
-
The morphological difference between glaucoma and other optic neuropathies.J Neuroophthalmol. 2015 Sep;35 Suppl 1(0 1):S8-S21. doi: 10.1097/WNO.0000000000000289. J Neuroophthalmol. 2015. PMID: 26274837 Free PMC article. Review.
-
[Principals and clinical applications of optical coherence tomography in glaucoma].Klin Monbl Augenheilkd. 2006 Aug;223(8):656-60. doi: 10.1055/s-2006-926820. Klin Monbl Augenheilkd. 2006. PMID: 16927220 Review. German.
Cited by
-
Rat optic nerve head anatomy within 3D histomorphometric reconstructions of normal control eyes.Exp Eye Res. 2015 Oct;139:1-12. doi: 10.1016/j.exer.2015.05.011. Epub 2015 May 26. Exp Eye Res. 2015. PMID: 26021973 Free PMC article.
-
Structural, functional and blood perfusion changes in the rat retina associated with elevated intraocular pressure, measured simultaneously with a combined OCT+ERG system.PLoS One. 2018 Mar 6;13(3):e0193592. doi: 10.1371/journal.pone.0193592. eCollection 2018. PLoS One. 2018. PMID: 29509807 Free PMC article.
-
In vivo imaging methods to assess glaucomatous optic neuropathy.Exp Eye Res. 2015 Dec;141:139-53. doi: 10.1016/j.exer.2015.06.001. Epub 2015 Jun 3. Exp Eye Res. 2015. PMID: 26048475 Free PMC article. Review.
-
Optical coherence tomography: history, current status, and laboratory work.Invest Ophthalmol Vis Sci. 2011 Apr 14;52(5):2425-36. doi: 10.1167/iovs.10-6312. Print 2011 Apr. Invest Ophthalmol Vis Sci. 2011. PMID: 21493951 Free PMC article. Review.
-
Assessment of neuroprotection in the retina with DARC.Prog Brain Res. 2008;173:437-50. doi: 10.1016/S0079-6123(08)01130-8. Prog Brain Res. 2008. PMID: 18929126 Free PMC article. Review.
References
-
- Anderson DR. The management of elevated intraocular pressure with normal optic discs and visual fields. I. Therapeutic approach based on high risk factors. Surv Ophthalmol 1977;21:479–89. - PubMed
-
- Sommer A . Intraocular pressure and glaucoma. Am J Ophthalmol 1989;107:186–8. - PubMed
-
- Radius RL, Pederson JE. Laser-induced primate glaucoma. II. Histopathology. Arch Ophthalmol 1984;102:1693–8. - PubMed
-
- Sawaguchi S , Yue BY, Fukuchi T, et al. Collagen fibrillar network in the optic nerve head of normal monkey eyes and monkey eyes with laser-induced glaucoma—a scanning electron microscopic study. Curr Eye Res 1999;18:143–9. - PubMed
-
- Morrison JC, Dorman-Pease ME, Dunkelberger GR, et al. Optic nerve head extracellular matrix in primary optic atrophy and experimental glaucoma. Arch Ophthalmol 1990;108:1020–4. - PubMed
Publication types
MeSH terms
Grants and funding
LinkOut - more resources
Full Text Sources
Other Literature Sources
Medical
Research Materials