. 2005 Sep;7(9):870-9.
doi: 10.1038/ncb1288. Epub 2005 Aug 21.

PDGFRbeta+ perivascular progenitor cells in tumours regulate pericyte differentiation and vascular survival

Affiliations

PDGFRbeta+ perivascular progenitor cells in tumours regulate pericyte differentiation and vascular survival

Steven Song et al. Nat Cell Biol. 2005 Sep.

Abstract

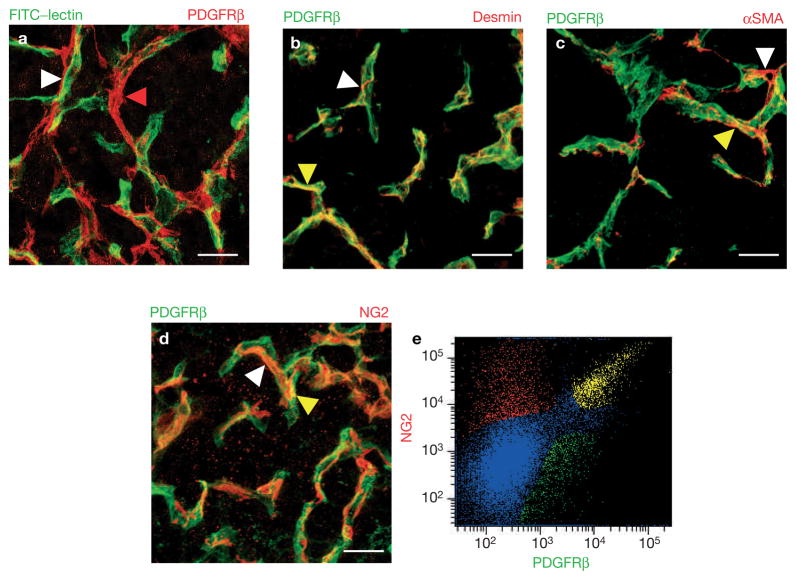
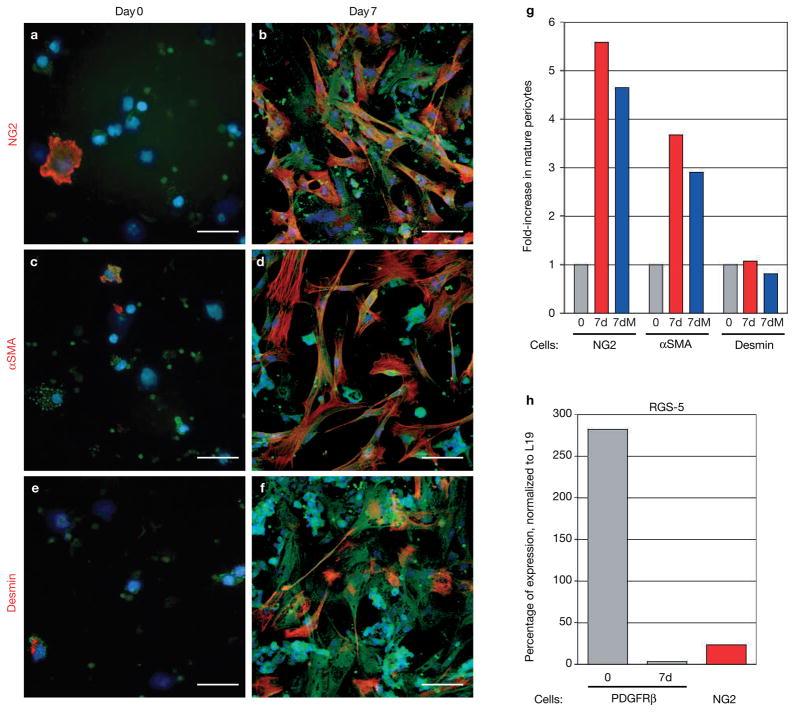
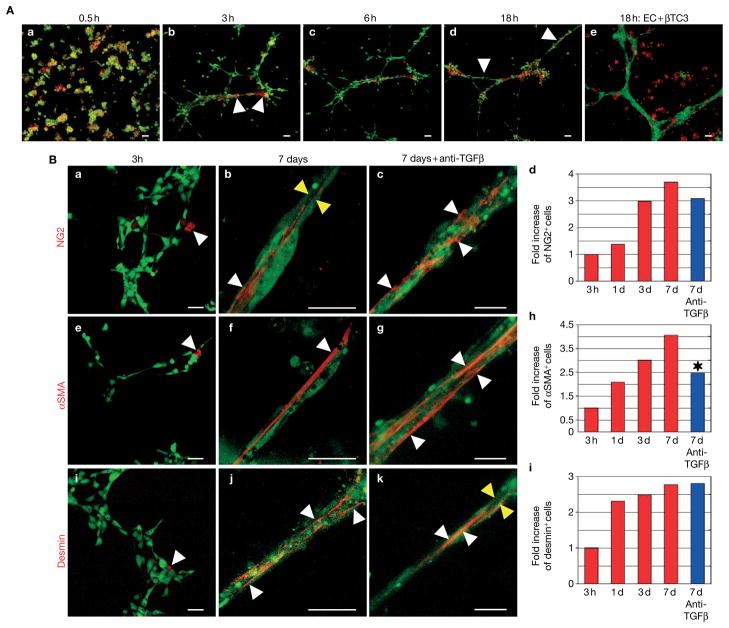
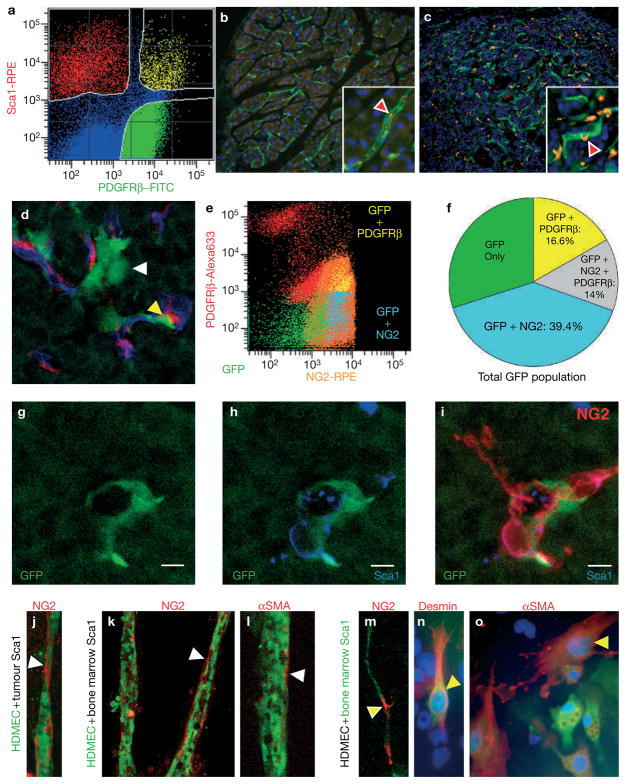
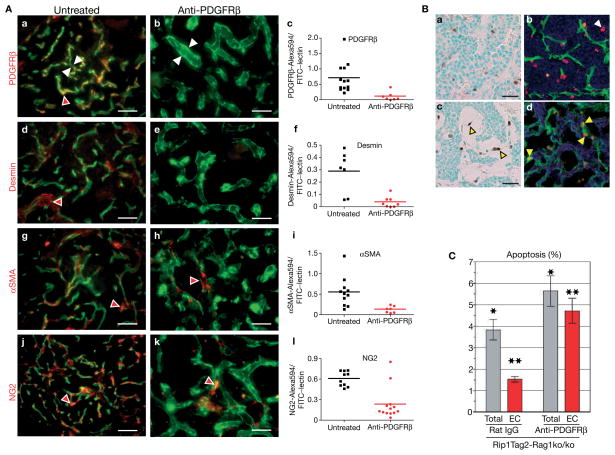
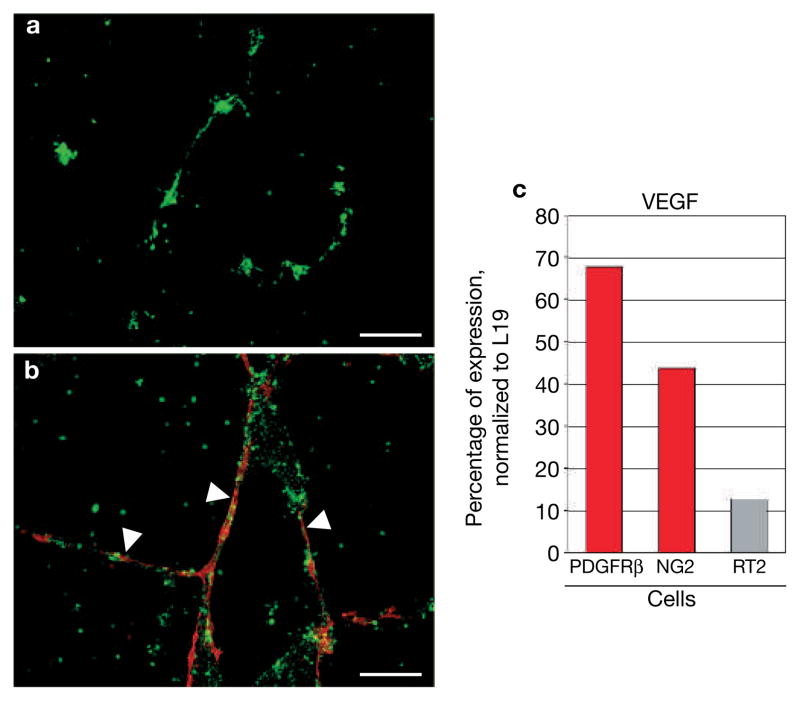
The microvasculature consists of endothelial cells and their surrounding pericytes. Few studies on the regulatory mechanisms of tumour angiogenesis have focused on pericytes. Here we report the identification of tumour-derived PDGFRbeta (+) (platelet-derived growth factor receptor beta) progenitor perivascular cells (PPCs) that have the ability to differentiate into pericytes and regulate vessel stability and vascular survival in tumours. A subset of PDGFRbeta (+) PPCs is recruited from bone marrow to perivascular sites in tumours. Specific inhibition of PDGFRbeta signalling eliminates PDGFRbeta (+) PPCs and mature pericytes around tumour vessels, leading to vascular hyperdilation and endothelial cell apoptosis in pancreatic islet tumours of transgenic Rip1Tag2 mice.


Conflict of interest statement

COMPETING FINANCIAL INTERESTS

The authors declare that they have no competing financial interests.

Figures

Figure 1
Figure 1
PDGFRβ+ cells are perivascular cells (PDGFRβ+ PVC) but are distinct from mature pericytes in tumours. (a) Blood vessels in pancreatic tumours were visualized with FITC-labelled tomato lectin (Lycopersicon esculentum) that was injected intravenously into 13-week-old Rip1Tag2 mice prior to killing them. Tumour sections were then stained with a red-labelled anti-PDGFRβ antibody. PDGFRβ+ cells are in close adjunction to blood vessels (white arrowhead) and can bridge between blood vessels (red arrowhead). (bd) Immunohistochemical analysis of PDGFRβ+ cells and mature pericytes (red). Tumour sections were co-stained with anti-PDGFRβ and anti-desmin (b), anti-αSMA (c) or anti-NG2 (d) to reveal colocalization. Predominantly, PDGFRβ+ cells were distinct from mature pericytes (white arrowheads), but expression overlapped in a few areas (yellow arrowheads). (e) Quantification of NG2+/PDGFRβ+ cell populations in Rip1Tag2 pancreatic tumours. Tumours were dispersed into single cells, incubated with antibodies for PDGFRβ and NG2 (red) and then sorted by FAC. Three cell populations were revealed: 46% expressed PDGFRβ but not NG2, 26% were immunoreactive for both PDGFRβ and NG2, while 28% only expressed NG2. αSMA+ and desmin+ pericytes could not be isolated by FACS due to the nature of the commercially available antibodies. Scale bars, 8.7 mm.
Figure 2
Figure 2
PDGFRβ+ cells differentiate into mature pericytes in vitro. (af) PDGFRβ+ cells were isolated from tumours with a green fluorescent PDGFRβ antibody that was coated to magnetic beads and then cultured in vitro. Cells were immunolabelled with antibodies for the mature pericyte markers NG2 (a, b), αSMA (c, d) or desmin (e, f) immediately after the cells had settled onto the dish (day 0; a, c, e) or after 7 days in culture (day 7; b, d, f). (g) PDGFRβ+ cells that were positive for either NG2, αSMA or desmin, were counted at day 0 and day 7 to reveal the induction of mature pericytes. Whereas NG2+ and αSMA+ cells increased about fourfold after 7-day culture when compared with freshly isolated cells, desmin+ cells did not expand in number during the cell culture. Addition of the cell-cycle blocker mitomycin-C (5–10 μg ml−1; 7dM) during culture did not change the ratio of pericyte differentiation. (h) Quantitative Taqman RT–PCR analysis for RGS-5, a marker of developing and angiogenic pericytes, was performed on total RNA isolated from tumour-derived PDGFRβ+ (freshly isolated and cultured for 7 days) and NG2+ cells in Rip1Tag2 tumours. Expression levels were normalized to those of L19. RGS-5 levels were very high in isolated PDGFRβ+ cells (day 0) but markedly reduced in differentiated PDGFRβ+ cells in culture (day 7), and in mature tumour-derived NG2+ pericytes. Scale bars, 9 mm.
Figure 3
Figure 3
PDGFRβ+ cells and endothelial cells in co-culture form pericyte-covered vascular tubes. (A) Time-lapse imagings of co-cultured endothelial cells and PDGFRβ+ cells (red) in 3D Matrigel at different time points. Human microvascular endothelial cells (HDMECs) were labelled with a green fluorescent vital dye and PDGFRβ+ cells, isolated from pancreatic tumours, with a red fluorescent vital dye and co-cultured in a 3D Matrigel. Vessel assembly was observed with a confocal microscope over a period of 18 h using time-lapse imaging. HDMECs were also cultured with the pancreatic islet tumour cells βTC3 over 18 h but these cells remained randomly distributed in the Matrigel (A, e). (B) Endothelial cell and PDGFRβ+ cell co-cultures form complex vascular tubes that are covered with mature periyctes leading to the induction of all three pericyte markers: NG2, desmin and αSMA. Endothelial cells and PDGFRβ+ cells (unlabelled) were co-cultured in Matrigel and the induction of NG2 (ad), αSMA (eh) and desmin (il) was visualized with red-labelled antibodies for the pericyte markers after 3 h (a, e, i) and 7 days in co-culture in the presence (b, f, j) or absence of TGFβ activity (c, g, k). Mature pericytes (red) elongate and wrap around endothelial tubes as indicated by white arrowheads. Endothelial tubes form a vessel lumen (yellow arrowheads). The increase in mature pericytes at 1-, 3- and 7-day cultures was quantified by comparing the ratio of pericytes at 1, 3 and 7 days to the numbers of cells at 3 h of incubation (d, h, l). In the presence of neutralizing TGFβ antibodies, αSMA+ cells, but not NG2+ or desmin+ cells, were reduced by 40% in a 7-day culture (*P = 0.0066). Scale bars, 2.3 mm (A), 5 mm (B, a, e, i), 14.9 mm (B, b, f, j), 9.9 mm (B, c, g, k).
Figure 4
Figure 4
Tumour-associated PDGFRβ+ PPCs originate from bone-marrow-derived haematopoietic Sca1+ cells. (a) Quantification of Sca1+/PDGFRβ+ cell populations in Rip1Tag2 pancreatic tumours. Tumours were dispersed into single cells, incubated with antibodies for PDGFRβ and Sca1 (red) and then sorted by FACS. Three populations were revealed: 67% expressed PDGFRβ but not Sca1, 19% were immunoreactive for both Sca1 and NG2, while 17% expressed only Sca1. (b, c) Sca1+ cells (red) in normal exocrine pancreas (b) and in pancreatic islet tumours (c). The vasculature is visualized in green with FITC–tomato lectin. Higher magnifications in the boxes visualize Sca1+ cells within blood vessels in normal pancreas (b; red arrowhead), whereas numerous Sca1+ cells were observed in close association with tumour vessels in the perivascular space (c; red arrowhead). (d) Tumour sections of irradiated Rip1Tag2 mice that were reconstituted with bone marrow cells from syngeneic actin–GFP mice. Bone-marrow-derived cells are visualized in green, the vasculature was labelled with rhodamine–lectin and changed to false colour blue, and NG2+ cells were detected with an antibody for NG2 in red. Yellow arrowhead points to a GFP–NG2 double-positive cell. FACS analysis of GFP–bone-marrow-reconstituted tumours reveals GFP cells that are positive for PDGFRβ and/or NG2. (f) Quantitative analysis of GFP cells expressing PDGFRβ and/or NG2. (gi) A subset of GFP cells in tumours (g) coexpress Sca1 (h) and NG2 (i). (jo) Tumour- (j) and bone marrow (ko)-isolated Sca1+ cells were co-cultured with HDMEC endothelial cells in a 3D Matrigel (jm) or as monolayers on plastic dishes (n, o). The induction of NG2 (j, k, m), αSMA (l, o) and desmin (n) was visualized with red-labelled antibodies for the pericyte markers after 5 days in co-culture. Either isolated Sca1+ cells were co-cultured with pre-labelled HDMECs (green vital dye) (jl), or Sca1+ cells were pre-labelled in green and cultured with unlabelled HDMEC (mo). The latter allowed the identification of double-positive cells by their combined green and red colour when Sca1+ cells expressed a mature pericyte marker (mo; yellow arrowheads). Sca1+ cells induced expression of NG2 (j, k, m), αSMA (l, n) and, to a lesser extent, desmin (o) after 5 days of culture. Scale bars, 7 mm (gi).
Figure 5
Figure 5
Inhibition of PDGFRβ signalling depletes pericytes and increases endothelial cell apoptosis. (A) Anti-PDGFRβ treatment in immunocompromised Rip1Tag2-Rag1ko/ko mice depletes tumour pericytes. Ten-week-old Rip1Tag2-Rag1ko/ko mice (n = 8) were subjected to rat anti-mouse PDGFRβ or saline (control) for 3 weeks. Mice were injected intravenously with FITC-labelled tomato lectin prior to sacrifice to visualize the vasculature in green. Subsequently, tumour sections of control and treated mice were stained with a red-labelled antibody for PDGFRβ (a, b), desmin (d, e), αSMA (g, h) or NG2 (j, k). In contrast to control tumours, very few pericytes were observed in treated tumours (red arrowheads). Pericyte-depleted blood vessels were enlarged and hyperdilated with vessels in control tumours (white arrowheads). Quantitative evaluation of the number of PDGFRβ+ (c), desmin+ (f), αSMA+ (i) and NG2+ (l) cells was revealed on control and treated tumour sections by red antibody staining. The total area of red staining within the tumour boundaries within each image (7–13 images per set) was quantified using Improvision’s Volocity 2.6.1. Statistical analysis was performed with an unpaired t-test comparing the pericyte coverage of control-treated to anti-PDGFRβ tumours. P values were considered statistically strongly significant (P < 0.01). (B) Anti-PDGFRβ treatment in Rip1Tag2-Rag1ko/ko mice increases endothelial cell apoptosis in tumours. Apoptotic cells in tumours of control (a, b) and anti-PDGFRβ-treated mice (c, d) were detected by TUNEL staining. Whereas apoptotic cells are more randomly distributed in control tumours (a), they are predominantly apparent in hyperdilated blood vessels of anti-PDGFRβ-treated tumours, reflecting endothelial cells undergoing apoptosis (c; yellow arrowheads). Co-staining of TUNEL-positive cells with an antibody against CD31 revealed the apoptotic index of endothelial cells in tumours of control rat IgG (b; white arrowhead) and anti-PDGFRβ-treated Rip1Tag2 mice (d; yellow arrowheads). (C) The apoptotic index of all cells (total) and endothelial cells (EC) in tumours of control rat IgG and anti-PDGFRβ-treated Rip1Tag2 mice. Six to seven tumour images containing a total of over 7,000 cells per group were used to determine the apoptotic index of the total cell population and the endothelial cell population within tumours. Statistical analysis comparing the rat IgG control group to the anti-PDGFRβ-treated group was performed with a two-tailed, unpaired t-test and P values were considered statistically significant (*P = 0.0038 for total apoptosis; **P = 0.0059 for endothelial cell apoptosis). Scale bars, 9.7 mm (A), 9.9 mm (B, a, c).
Figure 6
Figure 6
PDGFRβ+ cells support vascular tube stability and survival. (a, b) Human microvascular endothelial cells (HDMECs) were labelled with a green fluorescent vital dye and cultured in a 3D Matrigel in the absence (a) or presence (b) of tumour-isolated PDGFRβ+ cells (pre-labelled in red). Vessel assembly occurred quickly in both situations, but bare endothelial tubes started to deteriorate after 2 days in culture resulting in endothelial cell clumps after 7 days (a). In contrast, PDGFRβ+ cell-covered tubes (white arrowheads) remained intact even after 7 days (b). (c) Quantitative RT–PCR analysis of VEGF from total RNA of tumour-isolated PDGFRβ+ cells, NG2+ cells and from total Rip1Tag2 tumours (RT2). VEGF transcription levels were normalized to levels of L19. VEGF transcription levels are highly enriched in PDGFRβ+ cells and NG2+ pericytes compared with VEGF levels in Rip1Tag2 tumours. Scale bars, 12.6 mm.

References

    1. Sims DE. Diversity within pericytes. Clin Exp Pharmacol Physiol. 2000;27:842–846. - PubMed
    1. Gerhardt H, Betsholtz C. Endothelial-pericyte interactions in angiogenesis. Cell Tissue Res. 2003;314:15–23. - PubMed
    1. Cleaver O, Melton DA. Endothelial signaling during development. Nature Med. 2003;9:661–668. - PubMed
    1. Hirschi KK, D’Amore PA. Pericytes in the microvasculature. Cardiovasc Res. 1996;32:687–698. - PubMed
    1. Bergers G, Benjamin LE. Tumorigenesis and the angiogenic switch. Nature Rev Cancer. 2003;3:401–410. - PubMed

Publication types

MeSH terms

Substances