. 2005 Aug 22:6:204.
doi: 10.1186/1471-2105-6-204.

Tandem machine learning for the identification of genes regulated by transcription factors

Affiliations

Tandem machine learning for the identification of genes regulated by transcription factors

Deendayal Dinakarpandian et al. BMC Bioinformatics. .

Abstract

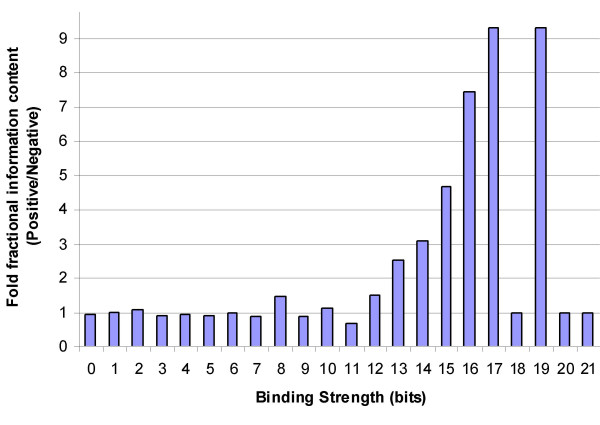
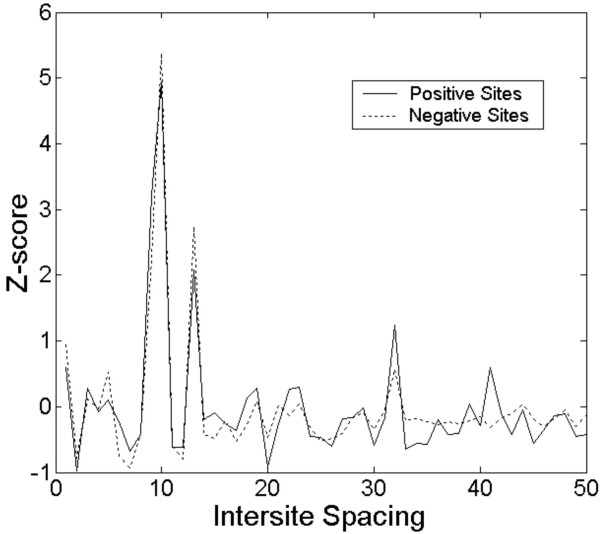
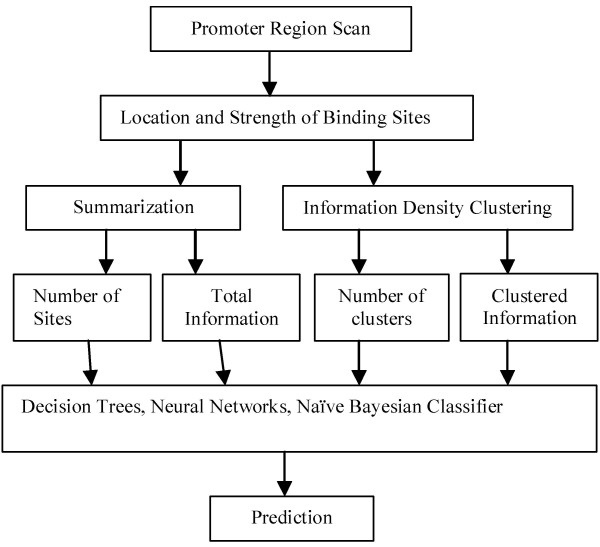
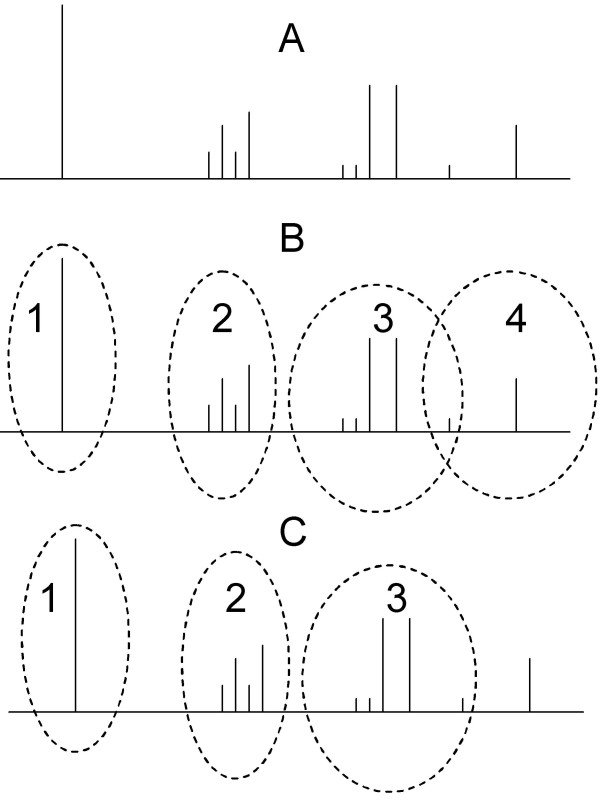
Background: The identification of promoter regions that are regulated by a given transcription factor has traditionally relied upon the identification and distributions of binding sites recognized by the factor. In this study, we have developed a tandem machine learning approach for the identification of regulatory target genes based on these parameters and on the corresponding binding site information contents that measure the affinities of the factor for these cognate elements.

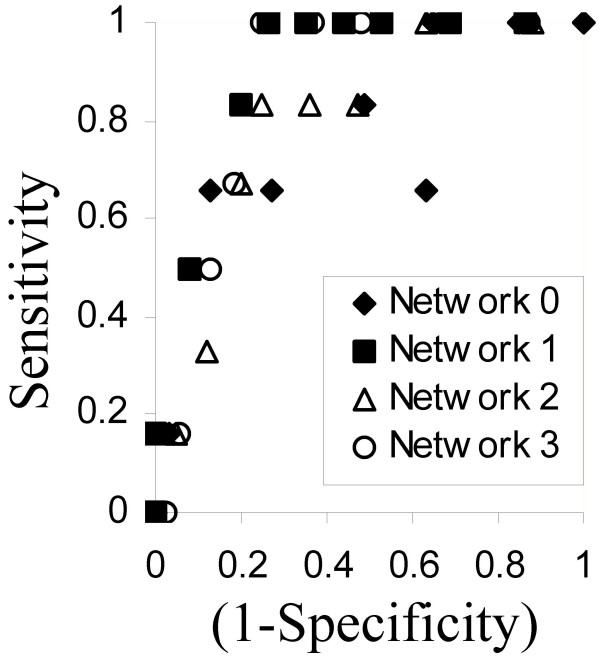
Results: This method has been validated using models of DNA binding sites recognized by the xenobiotic-sensitive nuclear receptor, PXR/RXRalpha, for target genes within the human genome. An information theory-based weight matrix was first derived and refined from known PXR/RXRalpha binding sites. The promoter region of candidate genes was scanned with the weight matrix. A novel information density-based clustering algorithm was then used to identify clusters of information rich sites. Finally, transformed data representing metrics of location, strength and clustering of binding sites were used for classification of promoter regions using an ensemble approach involving neural networks, decision trees and Naïve Bayesian classification. The method was evaluated on a set of 24 known target genes and 288 genes known not to be regulated by PXR/RXRalpha. We report an average accuracy (proportion of correctly classified promoter regions) of 71%, sensitivity of 73%, and specificity of 70%, based on multiple cross-validation and the leave-one-out strategy. The performance on a test set of 13 genes showed that 10 were correctly classified.

Conclusion: We have developed a machine learning approach for the successful detection of gene targets for transcription factors with high accuracy. The method has been validated for the transcription factor PXR/RXRalpha and has the potential to be extended to other transcription factors.


Figures

Figure 1
Figure 1
Higher proportion of information content lies within stronger sites in promoter regions of regulated genes. A histogram representing strengths of putative binding sites for the transcription factor RXR/RXRα is shown. The x-axis represents the binding strength of a site in bits. The y-axis represents the relative ratio between the proportions of total information found at the corresponding strength in regulated and unregulated promoter regions (10 kb upstream of respective genes).
Figure 2
Figure 2
Plot of inter-site distance and information content. The x-axis represents the spacing between a pair of sites expressed in number of bases, whereas the y-axis represents the corresponding pair-wise sum of information for all occurrences at a given spacing. The y-axis value is expressed in terms of a Z-score – units of standard deviation from the mean. The solid line represents the curve for a set of genes known to be regulated by PXR/RXRα, while the dotted line represents genes known to be unaffected by PXR/RXRα.
Figure 3
Figure 3
Overview of tandem machine learning. For each gene, the PWM representing binding sites for PXR/RXRα was used to scan the 10 kb region upstream of the transcription start site to generate a list of the location and strength of individual binding sites. This list was used to generate summary features, e.g., the total number of sites, total information content. It was also used as input for IDBC to generate clusters. A second set of summary features was extracted from the clustering obtained, e.g., total number of clusters, total information content within clusters. The combined list of features for each promoter region constituted a single data item for input to one of several machine-learning algorithm.
Figure 4
Figure 4
Information Density Based Clustering (IDBC) Algorithm. The steps of IDBC are described in the Methods section. Panel A shows the location of putative binding sites upstream of the transcription start site. The vertical height of each bar indicates the strength of the respective binding site. Panel B shows the initial list of 4 clusters derived from the first iteration of the algorithm. This includes an example of an overlap where one of the sites is shared between clusters 3 and 4. Panel C shows the result of a refining step where the overlapping point is resolved, exclusively, to cluster 3. Since the single site in cluster 4 is not strong enough to be a cluster, the final clustering has only 3 clusters.
Figure 5
Figure 5
ROC plot for Neural Network cross-validation. The training data was divided into multiple (n = 4 in this figure) non-overlapping sets. Each of the n sets was used to train a different neural network (NN) and tested on the remaining data. A Receiver Operating Curve was generated for each trained network by calculating specificity and sensitivity for different values of the cut-off for the output value to discriminate between regulated and unregulated gene targets. The ideal curve would be collinear with the y-axis for x = 0, and then run parallel to the x-axis as the line y = 1.

References

    1. Schneider TD. Information content of individual genetic sequences. J Theor Biol. 1997;189:427–441. doi: 10.1006/jtbi.1997.0540. - DOI - PubMed
    1. Stormo GD. DNA binding sites: representation and discovery. Bioinformatics. 2000;16:16–23. doi: 10.1093/bioinformatics/16.1.16. - DOI - PubMed
    1. Altschul SF, Madden TL, Schaffer AA, Zhang J, Zhang Z, Miller W, Lipman DJ. Gapped BLAST and PSI-BLAST: a new generation of protein database search programs. Nucleic Acids Res. 1997;25:3389–3402. doi: 10.1093/nar/25.17.3389. - DOI - PMC - PubMed
    1. Matys V, Fricke E, Geffers R, Gossling E, Haubrock M, Hehl R, Hornischer K, Karas D, Kel AE, Kel-Margoulis OV, Kloos DU, Land S, Lewicki-Potapov B, Michael H, Munch R, Reuter I, Rotert S, Saxel H, Scheer M, Thiele S, Wingender E. TRANSFAC: transcriptional regulation, from patterns to profiles. Nucleic Acids Res. 2003;31:374–378. doi: 10.1093/nar/gkg108. - DOI - PMC - PubMed
    1. Marchler-Bauer A, Anderson JB, Cherukuri PF, DeWeese-Scott C, Geer LY, Gwadz M, He S, Hurwitz DI, Jackson JD, Ke Z, Lanczycki CJ, Liebert CA, Liu C, Lu F, Marchler GH, Mullokandov M, Shoemaker BA, Simonyan V, Song JS, Thiessen PA, Yamashita RA, Yin JJ, Zhang D, Bryant SH. CDD: a Conserved Domain Database for protein classification. Nucleic Acids Res. 2005;33:D192–6. doi: 10.1093/nar/gki069. - DOI - PMC - PubMed

Publication types

MeSH terms

LinkOut - more resources