. 2005 Aug 29;170(5):721-32.
doi: 10.1083/jcb.200502073. Epub 2005 Aug 22.

Support for the immortal strand hypothesis: neural stem cells partition DNA asymmetrically in vitro

Affiliations

Support for the immortal strand hypothesis: neural stem cells partition DNA asymmetrically in vitro

Phillip Karpowicz et al. J Cell Biol. .

Erratum in

  • J Cell Biol. 2005 Sep 26;170(7):1169. Ramuns, John [corrected to Ramunas, John]

Abstract

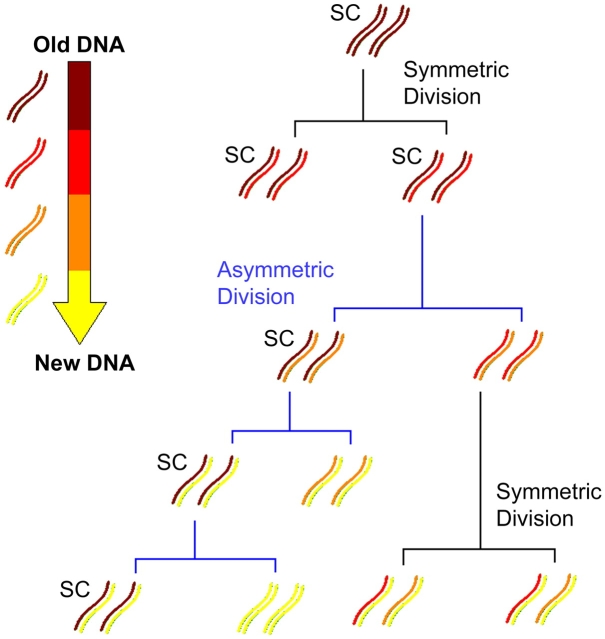
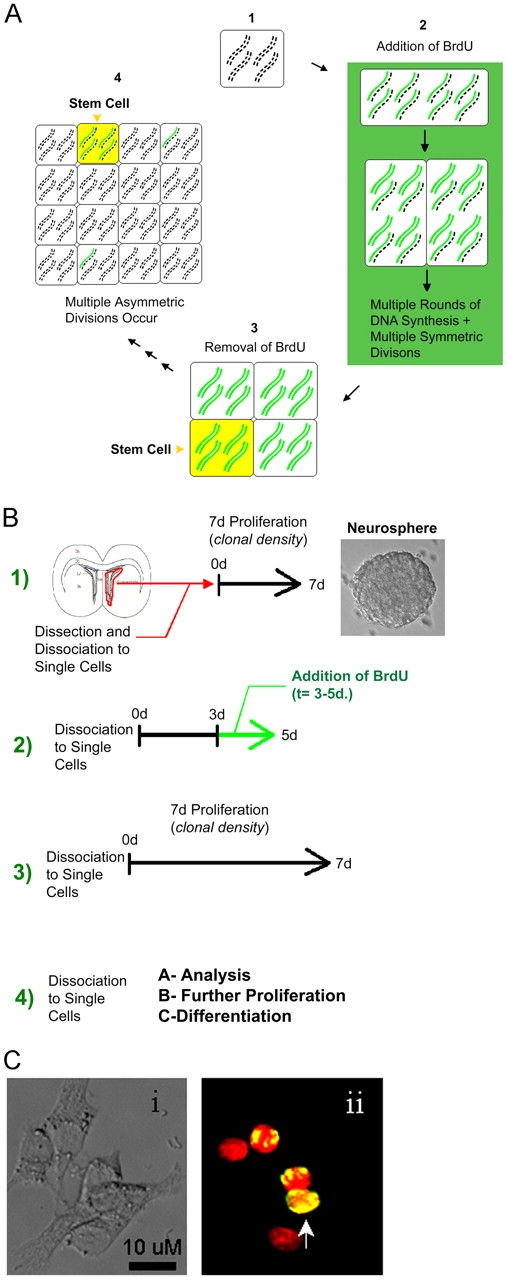
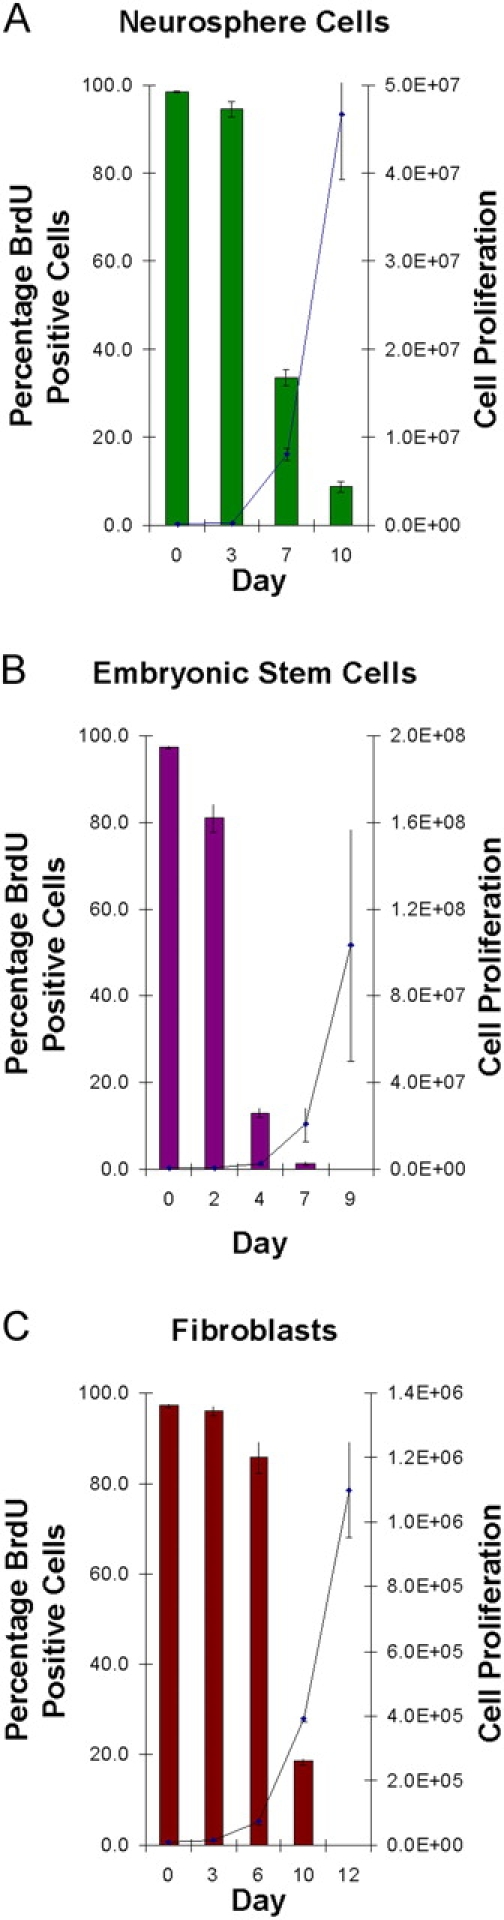
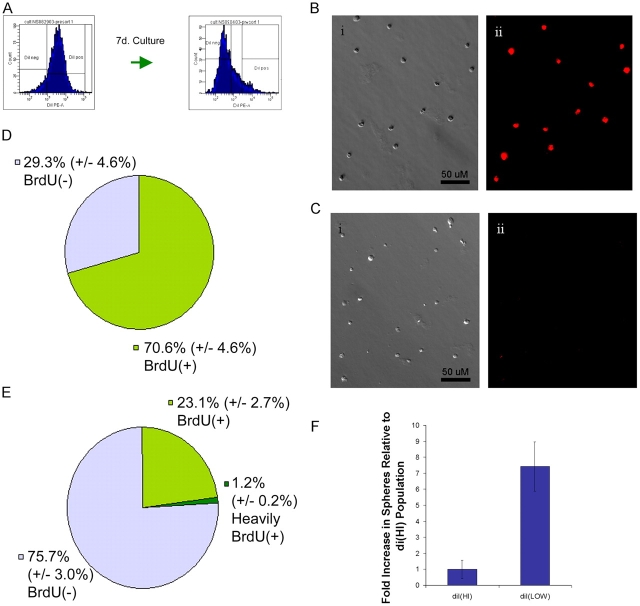
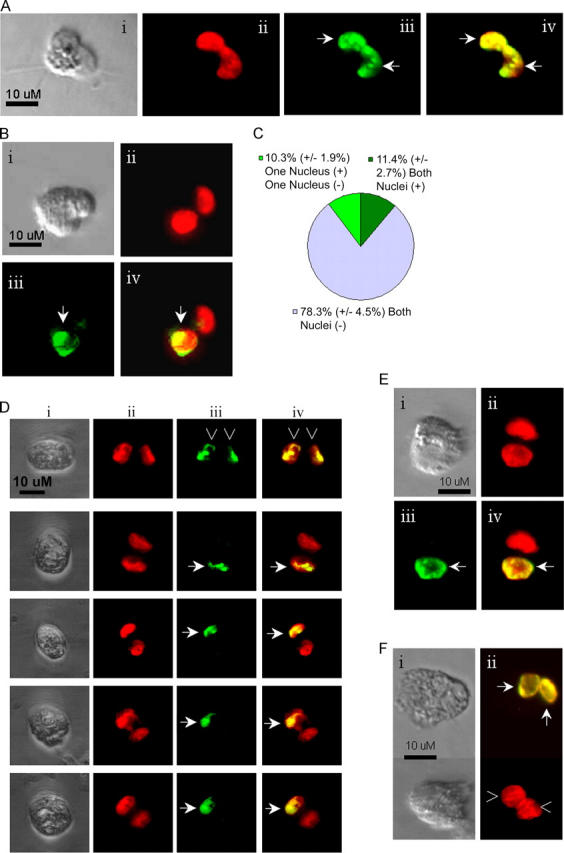
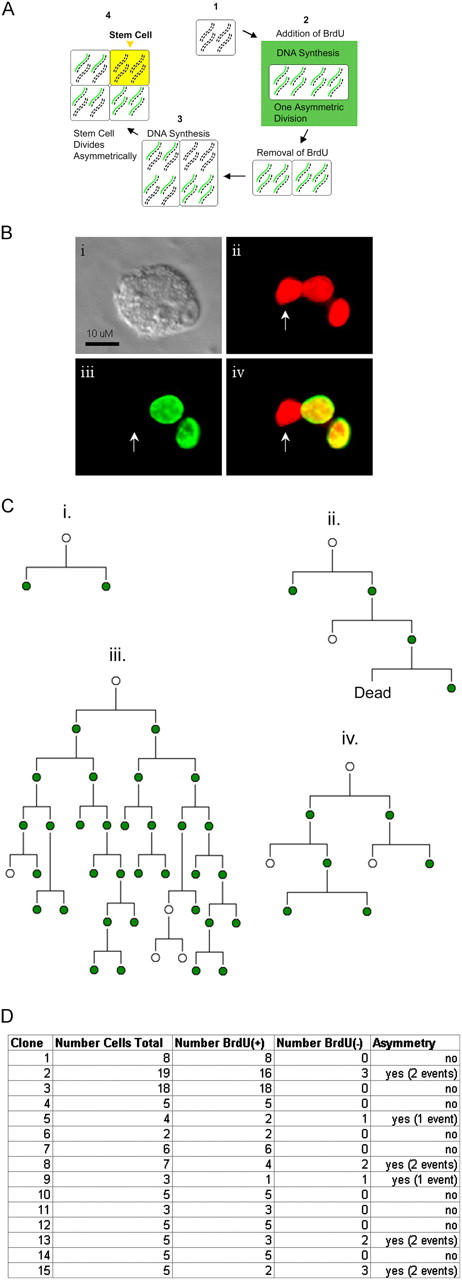
The immortal strand hypothesis proposes that asymmetrically dividing stem cells (SCs) selectively segregate chromosomes that bear the oldest DNA templates. We investigated cosegregation in neural stem cells (NSCs). After exposure to the thymidine analogue 5-bromo-2-deoxyuridine (BrdU), which labels newly synthesized DNA, a subset of neural precursor cells were shown to retain BrdU signal. It was confirmed that some BrdU-retaining cells divided actively, and that these cells exhibited some characteristics of SCs. This asymmetric partitioning of DNA then was demonstrated during mitosis, and these results were further supported by real time imaging of SC clones, in which older and newly synthesized DNA templates were distributed asymmetrically after DNA synthesis. We demonstrate that NSCs are unique among precursor cells in the uneven partitioning of genetic material during cell divisions.


Figures

Figure 1.
Figure 1.
Immortal strand hypothesis. During asymmetric SC divisions, chromosomes containing oldest template DNA (dark red) are segregated to SCs. DNA is replicated semiconservatively, each chromosome contains one older template strand. Complements of old DNA–containing chromosomes are cosegregated through many rounds of asymmetric cell division, although symmetric SC divisions segregate chromosomes randomly. Thus over time, SCs contain proportionally more template-containing chromosomes than any other cells in the population, which contain mostly newer synthesized DNA (yellow).
Figure 2.
Figure 2.
After a 2-d exposure to BrdU, cells from adult murine forebrain ventricles demonstrate heterogenous BrdU labeling in vitro. (A) BrdU retention strategy: (1) Each double strand (1 chromosome) represents 10 chromosomes of a mouse cell. Cells are unlabeled for BrdU (black). (2) During multiple rounds of DNA synthesis, BrdU (green) is taken up and distributed in both symmetric and asymmetric divisions in the presence of BrdU. (3) BrdU is removed and the daughter cells now undergo DNA synthesis in the absence of BrdU. (4) BrdU should be retained if labeled chromosomes are cosegregated as immortal strands into SCs. (B) BrdU–neurosphere assay. (1) Cells from adult forebrain lateral ventricles are cultured for 7 d at clonal density. (2) After dissociation, cells are pulsed with BrdU for 2 d, at 3 DIV. (3) BrdU is removed and cells are passaged at clonal density for an additional 7 d. (4) Cells are examined (A), passaged (B), or differentiated (C). (C) 10 d after BrdU exposure, cell clones still contained heavily BrdU(+) cells (arrows) and BrdU(−) cells. The retention of BrdU(+), in cells seeded at clonal density, suggests that BrdU(+) cells give rise to both labeled and unlabeled progeny. (i) Bright field shows 3 d cell clumps; (ii) histone-labeled nuclei are red, BrdU-labeled cells are green; merge shows overlap as yellow.
Figure 3.
Figure 3.
Neurosphere cells retain BrdU in contrast to ESCs and fibroblasts. (A) Proportion of BrdU-labeled cells (bars) and population expansion (line) in adult neurosphere culture. 98.6 ± 0.2% of 62,500 cells plated are BrdU(+). At day 3, cells have achieved two population doublings, and at 7 d, seven doublings. 8.7 ± 1.3% of cells retain BrdU signal at the 10 d time point of 10 population doublings. (B) Proportion of BrdU-labeled cells (bars) and population expansion (line) in the R1 ESC line. Between 2 and 4 d, embryonic cells have reached the threshold during which BrdU is lost, demonstrated by a dramatic decrease from 81.1 ± 3.2% to 13.0 ± 1.2% cells labeled. ESCs lose all BrdU signal after seven doublings evidenced by day 7 (six population doublings). (C) Proportion of BrdU-labeled cells (bars) and population expansion (line) in the STO fibroblast cell line. At day 6, cells achieve three populations doublings demonstrating that fibroblasts have 2× the cell cycle time as neural precursors. At day 12, and with less than seven doublings, fibroblasts' BrdU signal is abolished.
Figure 4.
Figure 4.
NSCs are fast dividing cells in vitro, and show BrdU retention. (A) Distribution of DiI, initially and after 1 wk in vitro. DiI signal decreases as a result of DiI dilution via cell proliferation. (DiI pos) DiI(HI+) fraction; (DiI neg) DiI(LOW+) fraction. (B) DiI(HI+) fraction of slowly dividing neurosphere cells where DiI signal is vivid. (i) Dissociated cells in bright field; (ii) DiI signal in red. (C) DiI(LOW+) fraction of rapidly dividing neurosphere cells where DiI signal is noticeably lower than in DiI(HI+) fraction. (i) Dissociated cells in bright field; (ii) DiI signal in red. (D) Data shows DiI(HI+) population (10% of total). As expected, slowly cycling cells do not greatly attenuate BrdU or DiI. The BrdU(−) population may be the same 1% of cells that are BrdU(−) immediately after BrdU exposure. (E) Data shows DiI(LOW+) population (63% of total). A subset of BrdU(+) cells are DiI(LOW+) after extended cell proliferation in vitro. BrdU retention in rapidly cycling cells suggests these are cosegregating their DNA. (F) Comparison in clonal sphere formation between DiI(HI+) and DiI(LOW+) fractions. The majority of neurospheres arise from the fast-cycling DiI(LOW+) population (7.5-fold increase over DiI[HI+]). This suggests SCs are in this actively proliferating fraction.
Figure 5.
Figure 5.
A proportion of BrdU-retaining cells possess markers of proliferating and undifferentiated neural progenitors. (A) All clones at 4 d after BrdU exposure are Nestin(+). (i) Bright field shows 4 d clone; (ii) Nestin is blue; (iii) BrdU-labeled nuclei are green; (iv) merge shows Nestin in blue, histone-labeled nuclei in red, and BrdU-labeled cells in green. (B) All clones 10 d after BrdU exposure contain Ki67(+) cells. Note strong Ki67 positivity of BrdU(+) cell (arrow). (i) Bright field shows clone; (ii) Ki67 expression is red; (iii) BrdU-labeled nuclei are green; (iv) merge shows Ki67 in red, BrdU-labeled cells are green, Hoechst-labeled nuclei are blue. (C) 14 d after BrdU differentiated clone, with arrows indicating GFAP(+) cell nucleus. (i) Bright field; (ii) merge shows GFAP in red and BrdU in green. (D)14 d after BrdU differentiated clone, with arrows indicating Nestin(+) cell nucleus. (i) Bright field; (ii) Nestin is blue; (iii) merge shows Nestin in blue, histone-labeled nuclei in red, and BrdU-labeled cells in green. (E) Clones arising from 7 d differentiated spheres (total of 17 d after BrdU). Cells show high Nestin(+) and undifferentiated cell morphology. (i) Bright field shows clone; (ii) Nestin is blue; (iii) BrdU-labeled nuclei are green; (iv) merge shows Nestin in blue, histone-labeled nuclei are red, and BrdU-labeled cells are green. (F) Numbers of Nestin(+) clones arising, from neurospheres exposed to differentiation conditions after BrdU removal. 3 DIV refers to clones that have been 17 d without BrdU, and 7 DIV clones have been without BrdU for 21 d. Nearly all clones at 3 DIV arise from BrdU(+) cells. The total number of SC colonies is slightly higher than this number (some taking longer to start proliferating), suggesting that all clones at 3 DIV are SC colonies.
Figure 6.
Figure 6.
Cell division inhibition of BrdU-retaining cells suggests asymmetric DNA partitioning. (A) BrdU distribution in a cell arrested during cytokinesis, 10 d after BrdU. Arrows indicate symmetric BrdU(+) nuclei in same cell. (i) Bright field shows binucleate cell; (ii) histone-labeled nuclei are red; (iii) BrdU is green; (iv) merge of histone and BrdU. (B) BrdU distribution in a cell arrested during cytokinesis, 10 d after BrdU. Arrows indicate BrdU(+) nucleus, adjacent to BrdU(−) nucleus, in same cell. (i) Bright field shows binucleate cell; (ii) histone-labeled nuclei are red; (iii) BrdU is green; (iv) shows merge of histone and BrdU. (C) BrdU distribution in binucleate cell population treated with cytochalasin D. Uneven segregation of labeled DNA to daughter nuclei occurs in 10% of the binucleate cell population. (D) Confocal microscopy of BrdU-exposed cells arrested during karyokinesis, 10 d after BrdU exposure. Upon removal of inhibitor, cells were timed for fixation at late anaphase or telophase. Mitotic cells were observed segregating labeled DNA nonrandomly to one daughter in top row (arrows), as opposed to the even segregation of BrdU in bottom examples (arrowheads). BrdU labeling was confirmed at all focal planes. (i) Bright field shows mitotic cells; (ii) histone-labeled nuclei are red; (iii) BrdU is green; (iv) merge of histone and BrdU. (E) Cell doublets arising from 10 d after BrdU cells inhibited during karyokinesis. Cells released from inhibition were allowed to complete mitosis. Uneven labeling of BrdU(+/−) daughter nuclei was again apparent (arrows). (i) Bright field shows two cells; (ii) histone-labeled nuclei are red; (iii) BrdU is indicated by green; (iv) merge of histone and BrdU. (F) Cell doublets arising from 10 d after BrdU cells inhibited during karyokinesis. Cells released from inhibition were allowed to complete mitosis. Some doublets displayed evenly labeled BrdU(+) daughters (arrows) or unlabeled, BrdU(−) doublets (arrowheads). (i) Bright field shows binucleate cells; (ii) merge of histone-labeled nuclei (red) and BrdU (green).
Figure 7.
Figure 7.
Live cell imaging supports nonrandom segregation of DNA. (A) Schematic showing BrdU imaging strategy. (1) Each double strand (1 chromosome) represents 10 chromosomes of a mouse cell. Cells are unlabeled for BrdU (black). (2) During DNA synthesis, BrdU (green) is taken up for exactly one division in the presence of BrdU. (3) BrdU is removed and the daughters enter a second round of DNA synthesis in the absence of BrdU. (4) Division events after the second round of DNA synthesis should show BrdU asymmetry if groups of unlabeled chromosomes are cosegregated as immortal strands into SCs. (B) A clone imaged in real time. After one division event, BrdU was removed, and colony was fixed after two further cell divisions in the absence of BrdU. Arrow indicates a cell that has cleared all BrdU signal. (i) Bright field shows clone; (ii) histone-labeled nuclei are red; (iii) BrdU is indicated by green; (iv) merge of histone and BrdU. (C) Lineage diagrams from four clones traced (ii–iv show asymmetric DNA partitioning). Clone (ii) is the same shown in B. Each lineage represents divisions of one single cell, plated in the presence of BrdU, which is taken up during the first division initially labeling daughter nuclei (green), as demonstrated in clone (i). BrdU was removed after this one division, and cells continued proliferating until analysis. Note, the presence of BrdU(+) is inferred in parental cells from their offspring. Dead cells were observed to disintegrate while imaging, before analysis. (D) Summary of clones traced. 6 out of 15 clones demonstrated asymmetric partitioning of new and old DNA.

References

    1. Aguilaniu, H., L. Gustafsson, M. Rigoulet, and T. Nystrom. 2003. Asymmetric inheritance of oxidatively damaged proteins during cytokinesis. Science. 299:1751–1753. - PubMed
    1. Cairns, J. 1975. Mutation selection and the natural history of cancer. Nature. 255:197–200. - PubMed
    1. Cairns, J. 2002. Somatic stem cells and the kinetics of mutagenesis and carcinogenesis. Proc. Natl. Acad. Sci. USA. 99:10567–10570. - PMC - PubMed
    1. Dalgaard, J.Z., and A.J. Klar. 2001. Does S. pombe exploit the intrinsic asymmetry of DNA synthesis to imprint daughter cells for mating-type switching? Trends Genet. 17:153–157. - PubMed
    1. Doetsch, F., I. Caille, D.A. Lim, J.M. Garcia-Verdugo, and A. Alvarez-Buylla. 1999. Subventricular zone astrocytes are neural stem cells in the adult mammalian brain. Cell. 97:703–716. - PubMed

MeSH terms