. 2005 Aug 30;102(35):12595-600.
doi: 10.1073/pnas.0503253102. Epub 2005 Aug 22.

Atomic force microscopy reveals the stoichiometry and subunit arrangement of 5-HT3 receptors

Affiliations

Atomic force microscopy reveals the stoichiometry and subunit arrangement of 5-HT3 receptors

Nelson P Barrera et al. Proc Natl Acad Sci U S A. .

Abstract

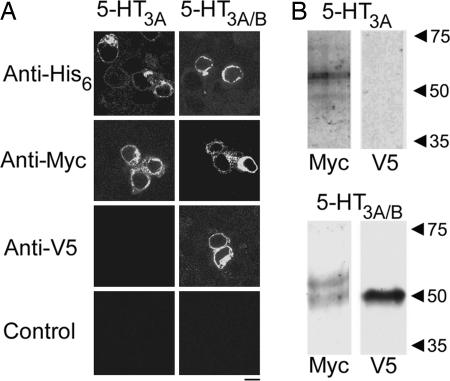
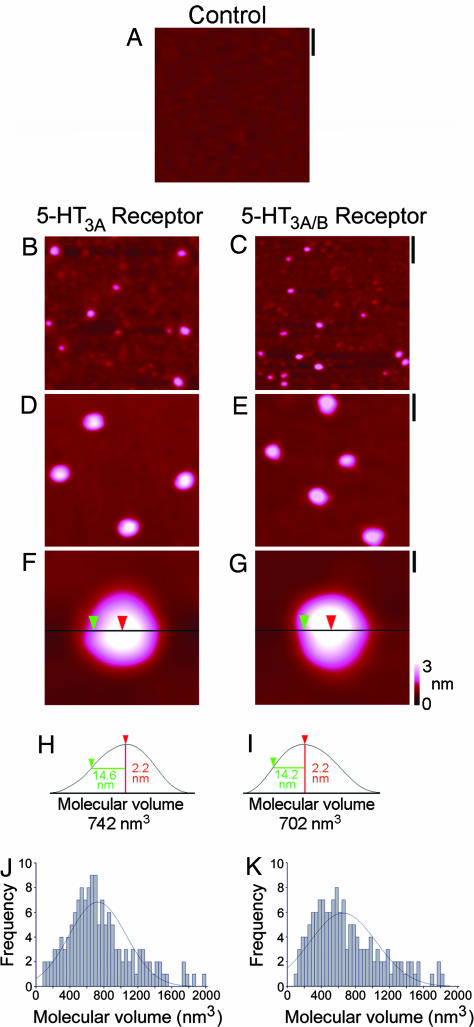
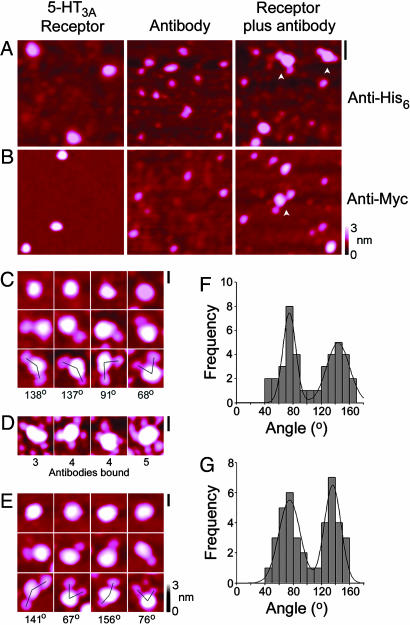
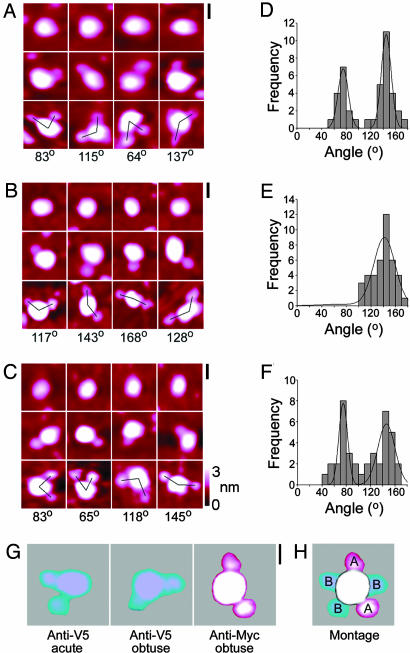
The 5-HT3 receptor is a cation-selective ligand-gated ion channel of the Cys-loop superfamily. The receptor is an important therapeutic target, with receptor antagonists being widely used as antiemetics in cancer therapy. The two known receptor subunits, A and B, form homomeric 5-HT 3A receptors and heteromeric 5-HT 3A/B receptors. The heteromeric receptor has the higher single-channel conductance and more closely mimics the properties of the native receptor. We have used atomic force microscopy to study the architecture of 5-HT 3A and 5-HT 3A/B receptors. We engineered different epitope tags onto the A- and B-subunits and imaged receptors that were doubly liganded by anti-epitope antibodies. We found that, for the 5-HT 3A/B receptor, the distribution of angles between antibodies against the A-subunit had a single peak at approximately 144 degrees , whereas the distribution for antibodies against the B-subunit had two peaks at approximately 72 degrees and 144 degrees . Our results indicate that the subunit stoichiometry is 2A:3B and that the subunit arrangement around the receptor rosette is B-B-A-B-A. This arrangement may account for the difference between the agonist Hill coefficients and the single-channel conductances for the two types of receptor.


Figures

Fig. 1.
Fig. 1.
Immunofluorescence and immunoblot analysis of 5-HT3 receptors. (A) Immunofluorescence detection of 5-HT3 receptors in transfected tsA 201 cells. Cells were fixed, permeabilized, and incubated with primary mAbs, followed by a Cy3-conjugated goat anti-mouse secondary Ab. In control incubations, the primary Ab was omitted. Cells were imaged by confocal laser scanning microscopy. (Scale bar, 10 μm.) (B) Detection of 5-HT3A and 5-HT3A/B receptors in eluates from Ni2+-agarose columns. Samples were analyzed by SDS/PAGE and immunoblotting, using monoclonal anti-Myc and anti-V5 primary Abs followed by a horseradish peroxidase-conjugated goat anti-mouse secondary Ab. Immunoreactive bands were visualized by using enhanced chemiluminescence.
Fig. 2.
Fig. 2.
AFM imaging of 5-HT3A and 5-HT3A/B receptors. (A) Low-magnification image of a sample prepared from mock-transfected cells. (Scale bar, 100 nm.) (B and C) Low-magnification images of 5-HT3A (B) and 5-HT3A/B (C) receptors. (Scale bar, 100 nm.) (D and E) Medium-magnification images. (Scale bar, 50 nm.) (F and G) High-magnification images of single 5-HT3A (F) and 5-HT3A/B (G) receptors. (Scale bar, 10 nm.) A color-height scale is shown at the right. (H and I) Sections through the receptors shown in F and G at the positions indicated by the lines. The height of the receptors and their radii at half height are shown. (J and K) Frequency distributions of molecular volumes of 5-HT3A (J) and 5-HT3A/B (K) receptors. The curves indicate fitted Gaussian functions.
Fig. 3.
Fig. 3.
AFM imaging of complexes between 5-HT3A receptors and anti-His-6 and anti-Myc Abs. (A and B) Images of receptors (Left), Abs (Center), and receptor-Ab complexes (Right). (Scale bar, 50 nm.) (C) Zoomed images of receptors that are uncomplexed (Top) or bound by one (Middle) or two (Bottom) anti-His-6 Abs. (D) Zoomed images of receptors bound by three to five anti-His-6 Abs. (E) Zoomed images of receptors that are uncomplexed (Top) or bound by one (Middle) or two (Bottom) anti-Myc Abs. (Scale bars: C-E, 20 nm.) (F and G) Frequency distributions of angles between anti-His-6 (F) or anti-Myc (G) Abs.
Fig. 4.
Fig. 4.
AFM imaging of complexes between 5-HT3A/B receptors and anti-His-6, anti-Myc, and anti-V5 Abs. (A-C) Zoomed images of receptors that are either uncomplexed (Top), or bound by one (Middle) or two (Bottom) anti-His-6 (A), anti-Myc (B), or anti-V5 (C) Abs. (D-F) Frequency distributions of angles between Abs for receptors doubly bound by anti-His-6 (D), anti-Myc (E), or anti-V5 (F) Abs. (G) Zoomed images of receptors that are doubly bound by either anti-V5 or anti-Myc Abs. (H) Composite of the three images shown in G illustrating the B-B-A-B-A arrangement of subunits around the receptor rosette. (All scale bars, 20 nm.)

References

    1. Corringer, P.-J., Le Novère, N. & Changeux, J.-P. (2000) Annu. Rev. Pharmacol. Toxicol. 40, 431-458. - PubMed
    1. Karlin, A. (2002) Nat. Rev. Neurosci. 3, 102-114. - PubMed
    1. Lester, H. A., Dibas, M. I., Dahan, D. S., Leite, J. F. & Dougherty, D. A. (2004) Trends Neurosci. 27, 329-336. - PubMed
    1. Boess, F. G., Lummis, S. C. R. & Martin, I. L. (1992) J. Neurochem. 59, 1692-1701. - PubMed
    1. Boess, F. G., Beroukhim, R. & Martin, I. L. (1995) J. Neurochem. 64, 1401-1405. - PubMed

Publication types