. 2005 Sep;11(9):973-81.
doi: 10.1038/nm1277. Epub 2005 Aug 14.

An astrocytic basis of epilepsy

Affiliations

An astrocytic basis of epilepsy

Guo-Feng Tian et al. Nat Med. 2005 Sep.

Abstract

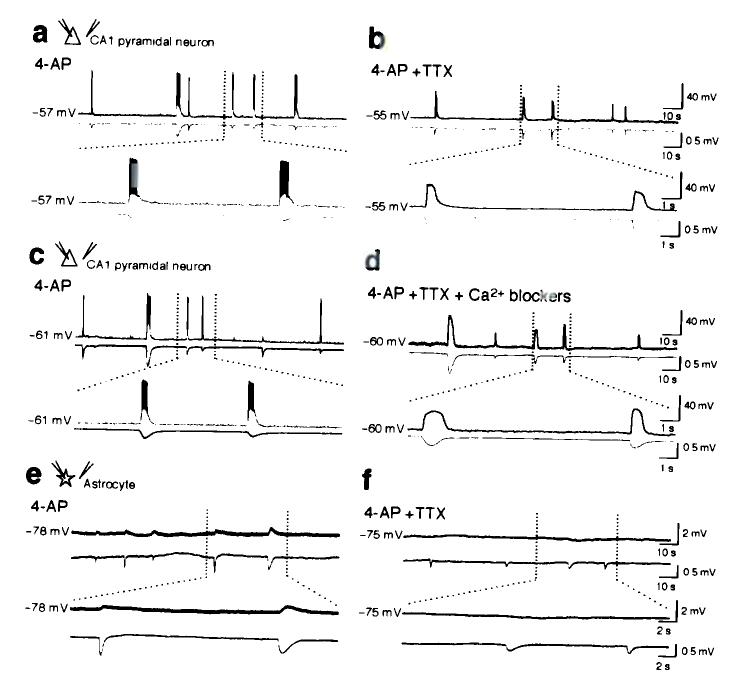
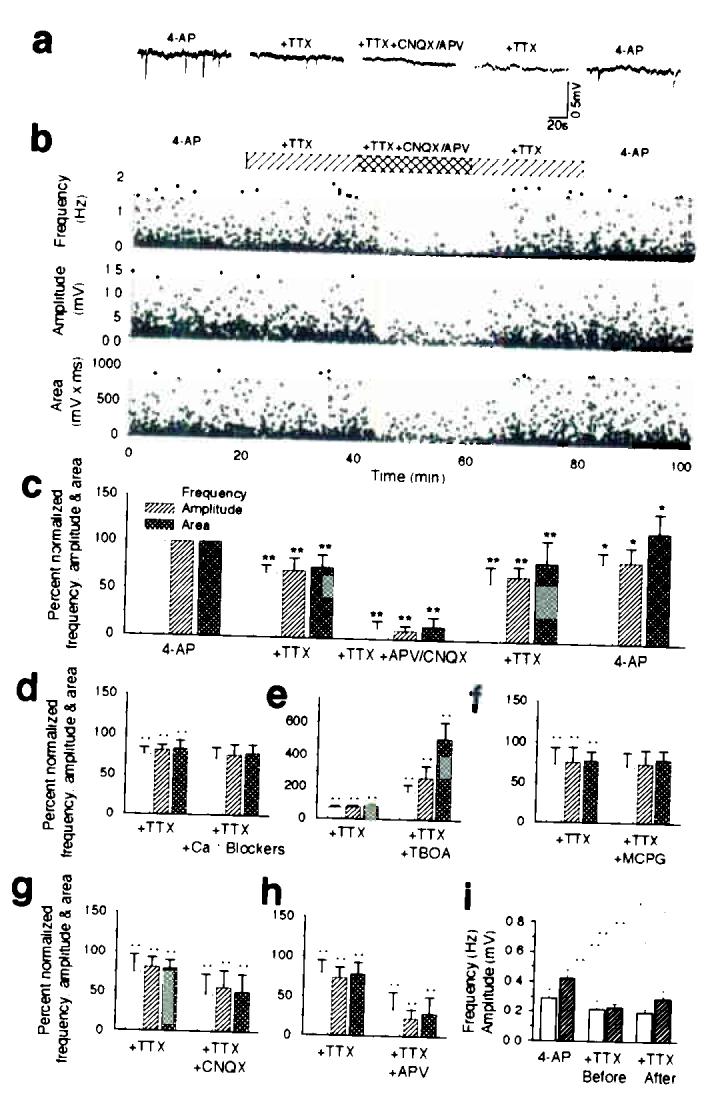
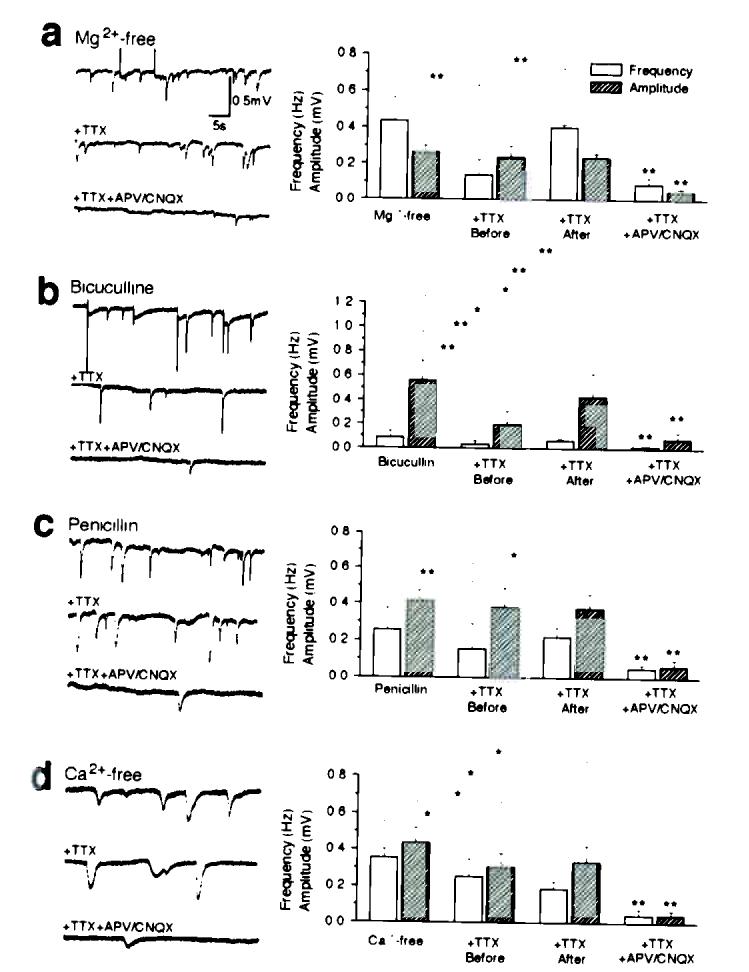
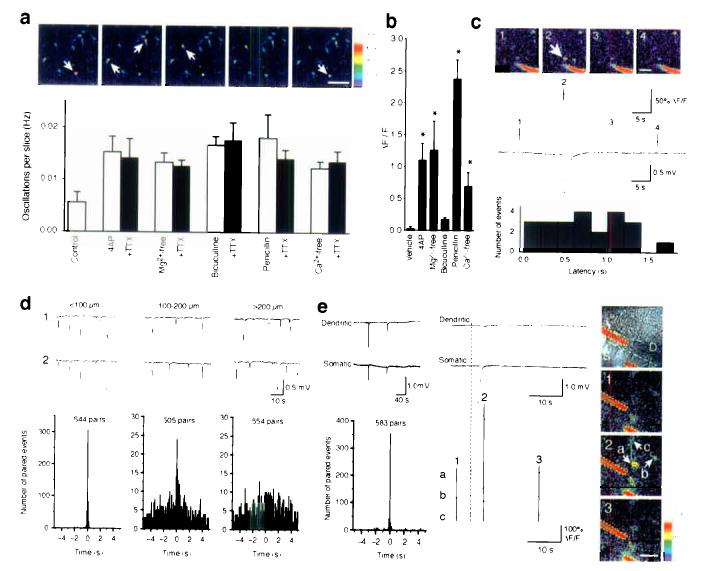
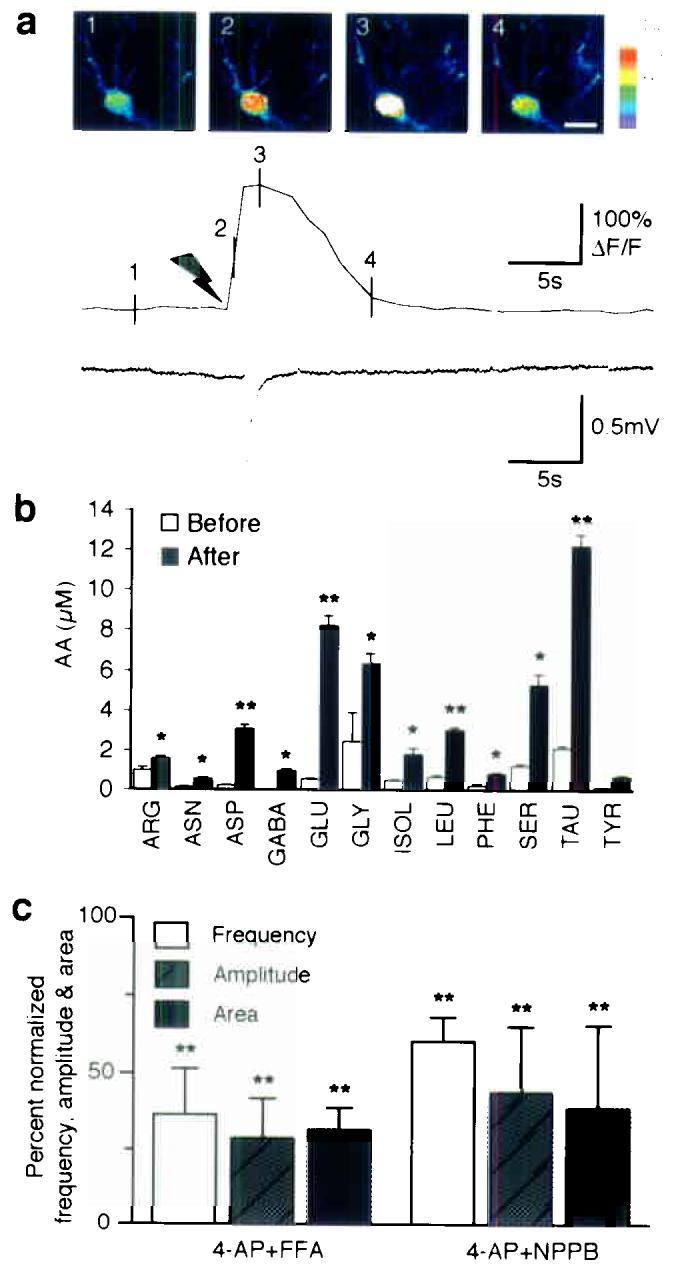
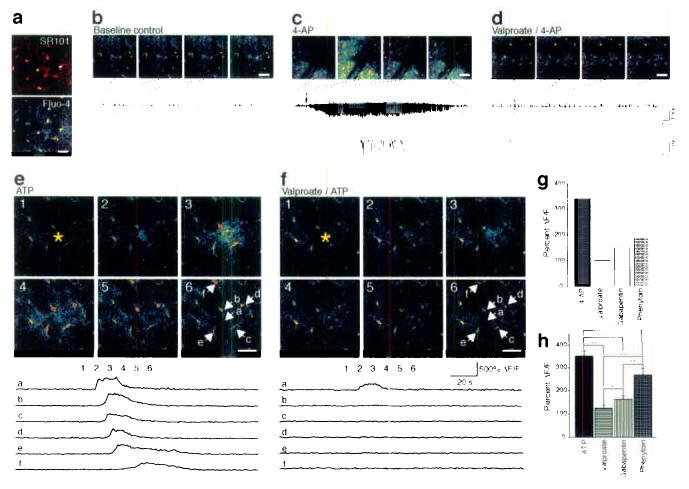
Hypersynchronous neuronal firing is a hallmark of epilepsy, but the mechanisms underlying simultaneous activation of multiple neurons remains unknown. Epileptic discharges are in part initiated by a local depolarization shift that drives groups of neurons into synchronous bursting. In an attempt to define the cellular basis for hypersynchronous bursting activity, we studied the occurrence of paroxysmal depolarization shifts after suppressing synaptic activity using tetrodotoxin (TTX) and voltage-gated Ca(2+) channel blockers. Here we report that paroxysmal depolarization shifts can be initiated by release of glutamate from extrasynaptic sources or by photolysis of caged Ca(2+) in astrocytes. Two-photon imaging of live exposed cortex showed that several antiepileptic agents, including valproate, gabapentin and phenytoin, reduced the ability of astrocytes to transmit Ca(2+) signaling. Our results show an unanticipated key role for astrocytes in seizure activity. As such, these findings identify astrocytes as a proximal target for the treatment of epileptic disorders.


Figures

Figure 1
Figure 1
Synaptic activity is not required for PDSs in hippocampal slices evoked by 4-AP. (a) Whole-cell recording of CA1 pyramidal neuron during epileptiform activity triggered by 4-AP (100 μM, upper trace) combined with field potential recording (lower trace). Spontaneous neuronal depolarization events elicit trains of action potentials, which are mirrored by negative deflections of the field potential. (b) Addition of TTX (1 μM) eliminated neuronal firing, but not the transient episodes of neuronal depolarizations and the drop in field potential. (c) 4-AP induced PDSs in a CA1 pyramidal neuron, (d) continue in presence of a cocktail of voltage-gated Ca2+ blockers, Nifedipine (L-type channel blocker, 10 μM); Mibefradil (T-type channel blocker, 10 μM); Omega-Conotoxin MVIIC (P/Q type Blocker, 1 μM); Omega-Conotoxin GVIA (N-type blocker, 1 μM); SNX-482 (R-type blocker, 0.1 μM) and TTX (1 μM). (e) Astrocytic membrane potential declined 0.5–1.0 mV during PDSs before, and (f) after addition of TTX. In all recordings, the field potential electrode was placed less than 30 μm from either the neuronal (ad), or astrocytic cell body (ef).
Figure 2
Figure 2
PDSs are mediated by release of glutamate from action potential-independent sources. (a) Representative traces of field potential recording in 4-AP; 4-AP and TTX; 4-AP, TTX, APV (50 μM), and CNQX (20 μM). (b) Frequency, amplitude and area (amplitude × duration) plotted as a function of time (n = 7). Spontaneous field potential events were observed in all slices exposed to 4-AP. The frequency and amplitude of PDSs were reduced by 20–35% by TTX and by 85–90% by APV and CNQX. (c) Normalized mean values of frequency, amplitude, and area (amplitude × duration) during exposure to 4-AP, 4-AP + TTX, 4-AP + TTX + APV/CNQX, during washout of APV/CNQX (4-AP + TTX), and during washout of TTX (4-AP) (n = 7). (d) The cocktail of VGCC blockers (Nifedipine, Mibefradil, Omega-Conotoxin MVIIC, Omega-Conotoxin GVIA, SNX-482, same concentration as in Fig. 1 and TTX did not decrease the frequency or amplitude of PDSs compared with TTX alone (n = 5). (e) D,L-threo-beta-benzyloxyaspartate (TBOA, a glutamate transport inhibitor, 100 μM) did not reduce the occurrence of PDSs, but increased the frequency, amplitude and area of PDSs significantly suggesting that inverted transport of glutamate did not contribute to PDSs (n = 6). (f) (S)-Alpha-methyl-4-carboxy-phenylglycine ((S)-MCPG, a non-selective mGluR antagonist, 1 mM) did not decrease the frequency or amplitude of PDSs compared with TTX alone (n = 7). (g) CNQX alone significantly reduced PDSs (n = 6). (h) APV alone highly significantly reduced PDSs (n = 6). (i) TTX added before (10–15 min) had no effect on frequency of PDSs, but significantly reduced the amplitude of PDSs compared with slices first exposed to TTX 20 min after addition of 4-AP (n = 7). *, P < 0.05; **, P < 0.001; student's t-test; mean ± s.d..
Figure 3
Figure 3
Spontaneous depolarization shifts in four experimental models of epilepsy. (a) Hippocampal slices were perfused with Mg2+-free solutions. Traces in left panel are representative field potential recordings in: Mg2+-free solution (upper); after addition of 1 μM TTX (middle), and after addition of TTX + 50 μM APV and 20 μM CNQX (lower). Left panel plots the frequency, amplitude, and area (amplitude × duration) of PDSs. (bd) Similar sets of observations in hippocampal slices exposed to bicuculline (b, 30 μM), Penicillin (c, 2000 U/ml), and Ca2+-free solution (d, 1 mM EGTA). *, P < 0.05; **, P < 0.001; student's t-test; mean ± s.d.; n = 5–7.
Figure 4
Figure 4
Epileptogenic agents evoke oscillatory increases in astrocytic cytosolic Ca2+ concentration, which precedes PDSs, and PDSs are spatially confined to small domains. (a) Upper panel: 2-photon imaging of astrocytic Ca2+ oscillations in stratum radiatum of the CA1 region in hippocampal slices exposed to 4-AP (100 μM) and TTX (1 μM). The frames were acquired with an interval of 8.2 s following 20 min exposure to 4-AP and TTX. White arrows indicate astrocytes with oscillatory increases in Ca2+. Scale bar, 50 μm. Lower panel: Histogram showing the frequency of Ca2+ oscillations in hippocampal slices exposed to 4-AP (100 μM), Mg2+-free solution, bicuculline (30 μM), penicillin (2000 U/ml), and Ca2+-free solution with and without TTX (1 μM) (mean ± s.d., n = 7). (b) Average increases in cytosolic Ca2+ in cultured astrocytes in response to 4-AP, Mg2+-free solution, bicuculline, penicillin, and Ca2+-free solution (mean ± s.d., n = 3). *, P < 0.05; ANOVA with Dunnett compared with vehicle. (c) Upper panel: 2-photon imaging of Ca2+ signaling combined with the field recordings in hippocampal slices exposed to 4-AP. The pipette solution contained 1 μM fluorescein-dextran to make the electrode visible during imaging (red in pseudocolor). White arrow indicates an astrocyte with a transient increase in cytosolic Ca2+. Scale bar, 30 μm. Middle panel: The rise in astrocytic Ca2+ concentration (upper tracing) preceded the negative deflection of the field potential (lower tracing). Numbers on the Ca2+ trace represent images in the upper panel. Lower panel: Histogram maps the latency between the onset of oscillatory increases in Ca2+ with the onset of drop in field potential. In all cases, astrocytic Ca2+ increment preceded the depolarization shift. (d) Both electrodes were placed in stratum radiatum of CA1. Representative tracings and summary histograms of dual field potential recordings with the electrodes placed at a distance of less than 100 μM (left panel); 100–200 μm (middle panel); and greater than 200 μm apart (right panel). (e) One electrode of the paired recordings was placed in stratum pyramidale of CA1 and the other one in stratum radiatum with a distance of less than 100 μM. Left panel: Representative tracings (top) and summary histograms (bottom) of dual field potential recordings. Central panel: Expanding recording traces (top) within the shadow area in top of left panel, the rise in astrocytic Ca2+ concentration (bottom) preceded the negative deflections of the field potentials. The numbers and letters are indicated in right panel. Right panel: The top photo is a DIC image which indicates the locations of the two electrodes. The other three photos are the 2-photon images of Ca2+ signaling in hippocampal slice exposed to 4-AP. White arrows indicate astrocytes with transient increases in cytosolic Ca2+. Scale bar, 20 μm.
Figure 5
Figure 5
Astrocytes are the primary source of glutamate in experimental seizure. (a) Photolysis of caged Ca2+ (NP-EGTA) in an astrocyte elicits a local depolarization shift in the presence of 1 μM TTX. Upper panel: Sequence of pseudocolor images of an astrocyte loaded with NP-EGTA/AM and fluo-4/AM. Delivery of UV pulses targeting the astrocyte elevates cytosolic Ca2+ and triggers a spontaneous depolarization shift with a latency of 1.3 s. Scale bar, 10 μm. Lower panel: traces of astrocytic Ca2+ concentration and field potential. Black arrow represents the delivery of UV pulses. Numbers on the Ca2+ trace represent images in the upper panel. (b) Profile of amino acids released in an adult rat perfused with 4-AP (5 mM) and TTX (10 μM) through a microdialysis probe implanted in hippocampus. The histogram maps amino acid release before and after stimulation. *, P < 0.05; **, P < 0.001; paired student's test, mean ± s.d., n = 4. (c) Anion channel inhibitors, both 5-nitro-2-(3-phenylpropylamino) benzoic acid (NPPB, 100 μM) and flufenamic acid (FFA, 100 μM), which reduce glutamate release from astrocytes, markedly decreased the frequency, amplitude and area of PDSs. **, P < 0.001 (Compared with 4-AP groups by paired student's t-test), mean ± s.d., n = 7.
Figure 6
Figure 6
Experimental seizure in adult mice and the effect of anti-epileptic agents on astrocytic Ca2+ signaling. (a) The primary somatosensory cortex was exposed and loaded with fluo-4/AM and the astrocyte specific dye, sulforhodamine (SR101). Spacebar, 25 μm. (b) Normal EEG activity and stable astrocytic cytosolic Ca2+ levels under resting condition in an anesthetized mouse. Images were collected 130 μm below the pial surface. (c) 4-AP was delivered locally by an electrode and triggered delayed spontaneous episodes of high frequency, large amplitude discharges and astrocytic Ca2+ signaling. (d) In an animal receiving valproate (450 mg/kg i.p.), 4-AP induced seizure activity and astrocytic Ca2+ signaling were reduced. (e) Astrocytic Ca2+ wave induced by iontophoretic application of ATP during basal condition, and (f) in an animal treated with valpropate (450 mg/kg i.p.). Lower panels map changes in fluo-4 emission (ΔF/F) as a function of time. (g) Histogram summarizing the effect of valproate, gabapentin (200 mg/kg i.p.), and phenytoin (100 mg/kg i.p.) on 4-AP induced astrocytic Ca2+ signaling (5-30 min after delivery of 4-AP). (h) Histogram summarizing the effect of valproate (450 mg/kg i.p.), gabapentin (200 mg/kg i.p.), and phenytoin (100 mg/kg i.p.) on ATP-induced Ca2+ waves. *, P < 0.05; **, P < 0.001; student's t-test; mean ± s.d.; n = 5–7. Space bar, 50 μm.

Comment in

References

    1. Wyllie E. The treatment of epilepsy Principles and Practice. lippincot, Williams, and Wilkins; New York: 2001.
    1. Heinemann U, Gabriel S, Schuchmann S, Eder C. Contribution of astrocytes to seizure activity. Adv. Neurol. 1999;79:583–590. - PubMed
    1. Rogawski MA, Loscher W. The neurobiology of antiepileptic drugs. Nat. Rev. Neurosci. 2004;5:553–564. - PubMed
    1. Meldrum BS. Update on the mechanism of action of antiepileptic drugs. Epilepsia. 1996;37(Suppl. 6):S4–11. - PubMed
    1. Parpura V, et al. Glutamate-mediated astrocyte-neuron signalling. Nature. 1994;369:744–747. - PubMed

Publication types