Comparative Study
. 2005 Dec;171(4):2085-95.
doi: 10.1534/genetics.105.047431. Epub 2005 Aug 22.

Disentangling linkage disequilibrium and linkage from dense single-nucleotide polymorphism trio data

Affiliations
Comparative Study

Disentangling linkage disequilibrium and linkage from dense single-nucleotide polymorphism trio data

Geraldine M Clarke et al. Genetics. 2005 Dec.

Abstract

Parent-offspring trios are widely collected for disease gene-mapping studies and are being extensively genotyped as part of the International HapMap Project. With dense maps of markers on trios, the effects of LD and linkage can be separated, allowing estimation of recombination rates in a model-free setting. Here we define a model-free multipoint method on the basis of dense sequence polymorphism data from parent-offspring trios to estimate intermarker recombination rates. We use simulations to show that this method has up to 92% power to detect recombination hotspots of intensity 25 times background over a region of size 10 kb typed at density 1 marker per 2.5 kb and almost 100% power to detect large hotspots of intensity >125 times background over regions of size 10 kb typed with just 1 marker per 5 kb (alpha = 0.05). We found strong agreement at megabase scales between estimates from our method applied to HapMap trio data and estimates from the genetic map. At finer scales, using Centre d'Etude du Polymorphisme Humain (CEPH) pedigree data across a 10-Mb region of chromosome 20, a comparison of population recombination rate estimates obtained from our method with estimates obtained using a coalescent-based approximate-likelihood method implemented in PHASE 2.0 shows detection of the same coldspots and most hotspots: The Spearman rank correlation between the estimates from our method and those from PHASE is 0.58 (p < 2.2(-16)).


Figures
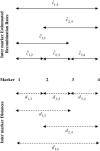
Figure 1.
Figure 1.
Consider four markers with intermarker distances noted. MLEs formula image, formula image, formula image, formula image, formula image, and formula image of the intermarker recombination fractions are made for each pair of markers. New estimates for the interval between markers 2 and 3 are made from markers 1 and 3, markers 2 and 4, and markers 1 and 4 as formula image, formula image, and formula image, respectively. A weighted average of these new estimates provides a final refined estimate, formula image, of the intermarker recombination fraction between markers 2 and 3.
Figure 2.
Figure 2.
Estimates of intermarker recombination fractions for randomly selected markers according to the number of overlapping markers used to refine the estimate. Axes at the top of each plot show how many flanking markers have been used to refine the estimate. Axes at the bottom of each plot show the equivalent number of overlapping pairs of markers that have been used to refine the estimate. For example, allowing up to 5 flanking markers creates 5 + 4 + 3 + 2 + 1 = 15 overlapping marker pairs used to refine the intermarker estimate. Each row shows estimates for randomly selected adjacent markers from simulations with true hotspot intensities (A) 10, (B) 25, (C) 125, and (D) 625. The value HS in under each plot indicates how many markers away from a hotspot the represented marker pair are located: Plots i and ii show results for intermarker estimates located within a hotspot (HS = 0); plots iii–v show results for intermarker estimates located outside a hotspot. The dotted lines indicate 95% normal confidence intervals. Results are for simulations in 200 trios of 400 SNP markers at a mean spacing of 2.5 kb over a 1-Mb region with three evenly spaced hotspots.
Figure 3.
Figure 3.
Estimates of intermarker recombination rates, in centimorgans per megabase, plotted at marker midpoint location (in megabases) for simulations with true hotspot intensities (A) 10, (B) 25, (C) 125, and (D) 625 times background. Each row shows results for the given true hotspot intensity at w = 10, 20, 40, and 60 flanking markers: w flanking markers means that intermarker recombination fraction estimates from all marker pairs within w markers of a given pair of markers were used to refine the estimate at that given marker pair. Results are for simulations in 200 trios of 400 SNP makers at a mean spacing of 2.5 kb over a 1-Mb region with three evenly spaced hotspots. The solid vertical dashed lines indicate the true locations of the hotspots. Refer to text for discussion of how intermarker recombination fraction estimates formula image are converted to genetic distances in centimorgans per megabase.
Figure 4.
Figure 4.
Estimates of intermarker recombination rates, in centimorgans per megabase, plotted at marker midpoint location (in megabases) for simulations with true hotspot intensities (A) 10, (B) 25, (C) 125, and (D) 625 times background and where offspring have been generated with a mean population recombination rate of four recombinations per megabase per generation over the simulated sequence. Results are for w = 60 flanking markers: w flanking markers means that intermarker recombination fraction estimates from all marker pairs within w markers of a given pair of markers were used to refine the estimate at that given marker pair. Results are for simulations in 200 trios of 400 SNP markers at a mean spacing of 2.5 kb over a 1-Mb region with three evenly spaced hotspots. The solid vertical dashed lines indicate the true locations of these hotspots. The solid crosses indicate the true locations of recombinations occurring in offspring meioses. Refer to the text for a discussion of how intermarker recombination fraction estimates formula image are converted to genetic distances in centimorgans per megabase.
Figure 5.
Figure 5.
Estimated mean hotspot intensity coefficient over 1000 simulations with true hotspot intensities (A) 10, (B) 25, (C) 125, and (D) 625 times background according to the number of flanking markers used to refine estimates. For each simulation, intermarker recombination rates are estimated for flanking markers, w = 1, … , 10, 20, 30, 40, and 60. w flanking markers means that intermarker recombination fraction estimates from all marker pairs within w markers of a given pair of markers were used to refine the estimate at that given marker pair. For each value of w, the hotspot intensity coefficient is then calculated as the estimated mean recombination rate (centimorgans per megabase) at the simulated hotspot sites divided by that at the simulated nonhotspot sites. The estimated mean hotspot intensity coefficient for a simulation group is then given by averaging values over all simulations. The dotted lines are 95% bootstrap confidence intervals. Results are for simulations in 200 trios of 400 SNP markers at a mean spacing of 2.5 kb over a 1-Mb region with three evenly spaced hotspots.
Figure 6.
Figure 6.
Power to detect a hotspot of true intensity (A) 10, (B) 25, (C) 125, and (D) 625 times background according to the number w of flanking markers used to refine estimates: w flanking markers means that intermarker recombination fraction estimates from all marker pairs within w markers of a given pair of markers were used to refine the estimate at that given marker pair. Results are for simulations in 200 trios of 400 SNP markers at mean spacings of 2, 2.5, and 5 kb: Each line corresponds to a different marker density, as indicated in the inset. Type I error rate is 0.05.
Figure 7.
Figure 7.
Estimated mean recombination rates at a 2-Mb scale on chromosome 3 (top) and on the long arm of chromosome 22 (bottom). The black lines show estimates from our method based on 70,470 (chromosome 3) and 19,017 (chromosome 22) SNP markers from HapMap CEPH trio data (release March 2005) averaged over 2-Mb windows at 1-Mb intervals. The red lines show sex-averaged recombination rates estimated from pedigree data (Kong et al. 2002).
Figure 8.
Figure 8.
Estimates of intermarker recombination rates (centimorgans per megabase) plotted at marker midpoint location (in megabases) across a 10-Mb region of chromosome 20: 20q12–20q13.13. The red line shows results from PHASE based on 4513 SNP markers genotyped on 46 CEPH founders. The black line shows results from our method based on 5355 SNP markers genotyped on 21 CEPH founder-offspring trios. We used 60 flanking markers to refine our intermarker estimates: w flanking markers, for example, means that intermarker recombination fraction estimates from all marker pairs within w markers of a given pair of markers were used to refine the estimate at that given marker pair. Estimates made using our method are scaled to ensure that the average of centimorgans per megabase across the region matches that from pedigree data (Kong et al. 2002).

Comment in

References

    1. Dausset, J., H. Cann, D. Cohen, M. Lahtrop, J. M. Lalouel et al., 1990. Centre d'Etude du Polymorphisme Humain (CEPH): collaborative genetic mapping of the human genome. Genomics 6: 575–577. - PubMed
    1. Devlin, B., N. Risch and S. Roeder, 1996. Disequilibrium mapping: composite likelihood for pairwise disequilibrium. Genomics 36: 1–16. - PubMed
    1. Dudbridge F., B. P. C. Koeleman, J. A. Todd and D. G. Clayton, 2000. Unbiased application of the transmission/disequilibrium test to multilocus haplotypes. Am. J. Hum. Genet. 66: 2009–2012. - PMC - PubMed
    1. Edwards, A., 1992. Likelihood. John Hopkins University Press, Baltimore.
    1. Efron, B., and R. Tibshirani, 1993. An Introduction to the Bootstrap. Chapman & Hall, London/New York.

Publication types