Comparative Study
. 2005 Aug 24;25(34):7821-30.
doi: 10.1523/JNEUROSCI.1790-05.2005.

5-HT7 receptor is coupled to G alpha subunits of heterotrimeric G12-protein to regulate gene transcription and neuronal morphology

Affiliations
Comparative Study

5-HT7 receptor is coupled to G alpha subunits of heterotrimeric G12-protein to regulate gene transcription and neuronal morphology

Elena Kvachnina et al. J Neurosci. .

Abstract

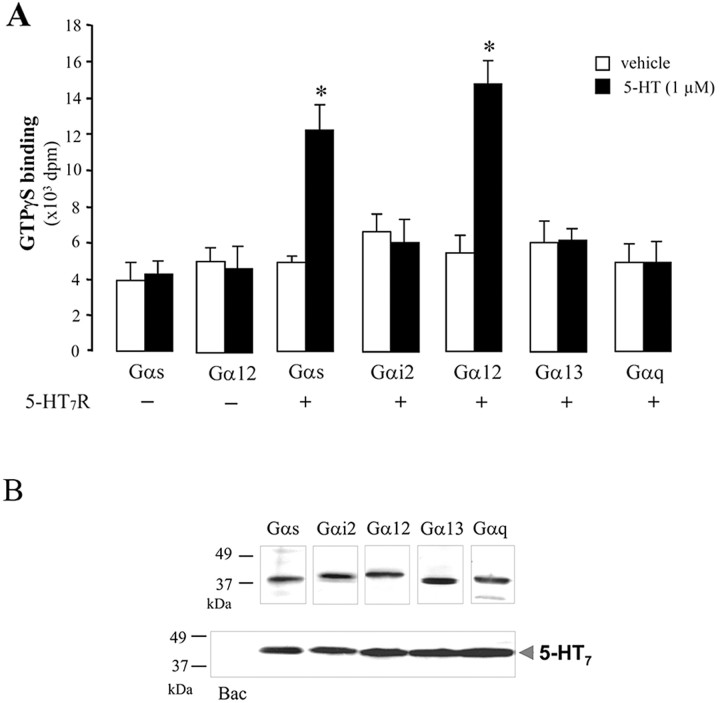
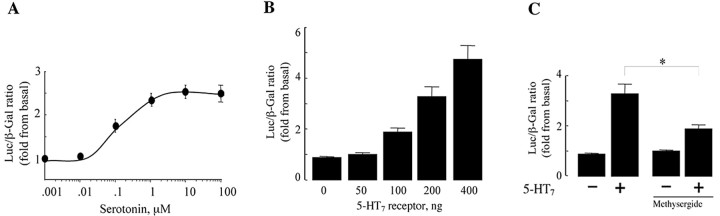
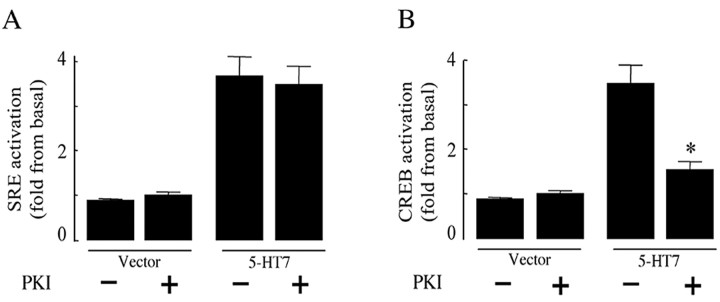
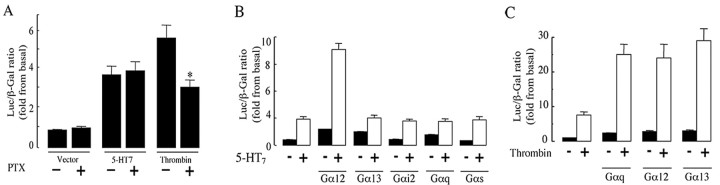
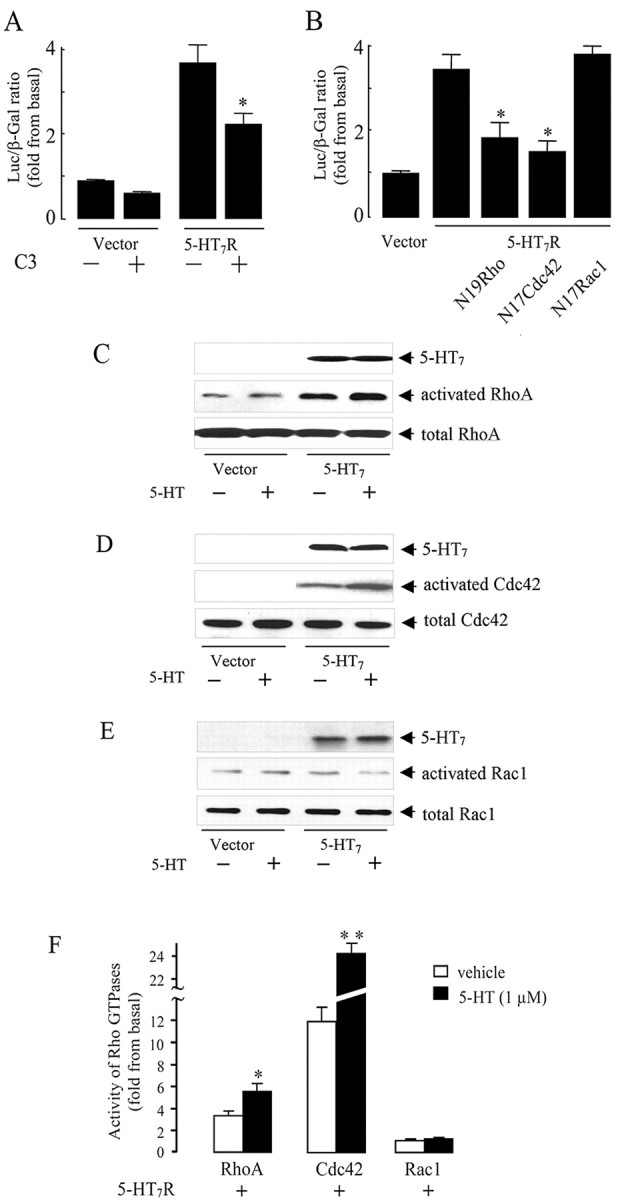
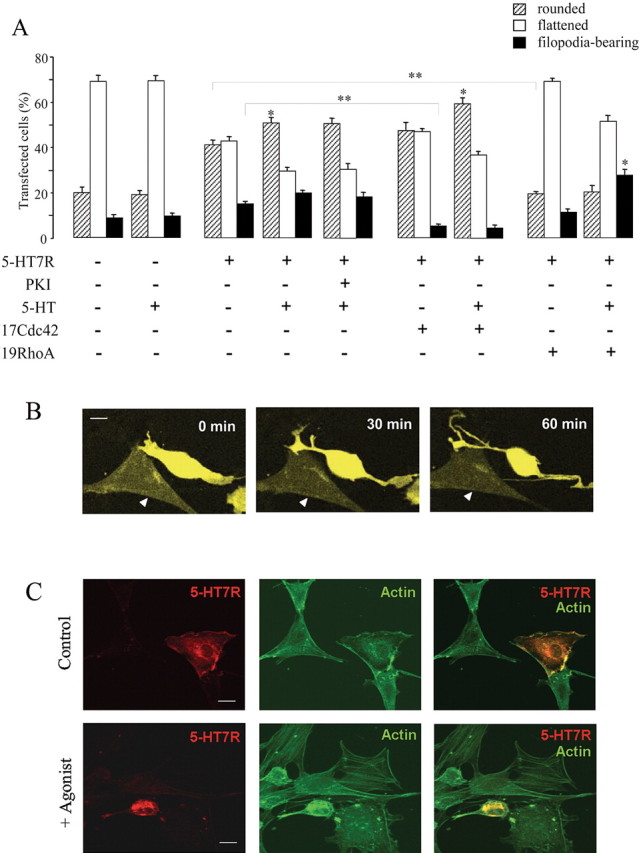
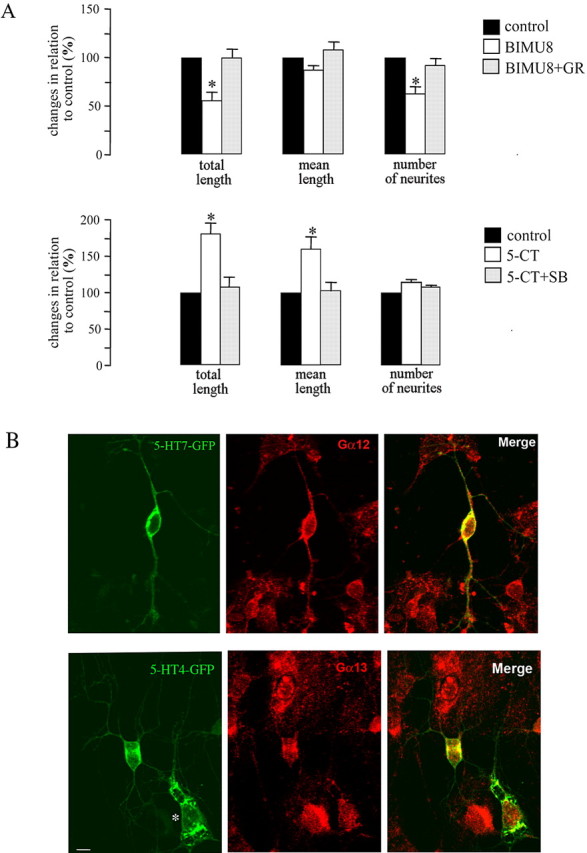
The neurotransmitter serotonin (5-HT) plays an important role in the regulation of multiple events in the CNS. We demonstrated recently a coupling between the 5-HT4 receptor and the heterotrimeric G13-protein resulting in RhoA-dependent neurite retraction and cell rounding (Ponimaskin et al., 2002). In the present study, we identified G12 as an additional G-protein that can be activated by another member of serotonin receptors, the 5-HT7 receptor. Expression of 5-HT7 receptor induced constitutive and agonist-dependent activation of a serum response element-mediated gene transcription through G12-mediated activation of small GTPases. In NIH3T3 cells, activation of the 5-HT7 receptor induced filopodia formation via a Cdc42-mediated pathway correlating with RhoA-dependent cell rounding. In mouse hippocampal neurons, activation of the endogenous 5-HT7 receptors significantly increased neurite length, whereas stimulation of 5-HT4 receptors led to a decrease in the length and number of neurites. These data demonstrate distinct roles for 5-HT7R/G12 and 5-HT4R/G13 signaling pathways in neurite outgrowth and retraction, suggesting that serotonin plays a prominent role in regulating the neuronal cytoarchitecture in addition to its classical role as neurotransmitter.


Figures

Figure 1.
Figure 1.
Communication of the 5-HT7 receptor with different G-proteins. A, Membranes were prepared from Sf.9 cells expressing or not expressing the 5-HT7 receptor together with recombinant G-proteins as indicated and then incubated with [35S]GTPγS in the presence of either vehicle (H2O) or 1 μm 5-HT. Immunoprecipitations were performed with appropriate antibodies directed against indicated Gα subunits. Data points represent the means ± SEM from at least four independent experiments performed in duplicate. Statistically significant differences between values obtained with or without stimulation are indicated (*p < 0.01). B, Expression analysis of the 5-HT7 receptor and G-proteins. Sf.9 cells infected with baculoviruses encoding for recombinant, myc-tagged 5-HT7 receptor and for different heterotrimeric G-proteins (Gs, Gi2, G12, G13, and Gq) or with a baculovirus alone (Bac) were subjected to Western blot analysis with anti-myc or appropriate anti-Gα subunit antibodies. The molecular weight marker is indicated to the left.
Figure 2.
Figure 2.
Agonist-induced activation of SRE via 5-HT7 receptor. A, Dose-dependent activation of SRE by serotonin in the NIH3T3 cells expressing the 5-HT7 receptor. NIH3T3 cells seeded onto 24-well plates were transfected with 100 ng of 5-HT7 receptor cDNA, 50 ng of pSRE.L, and 50 ng of pCMV-β-gal vectors. Twenty-four hours after transfection, cells were serum-starved for 16 h and stimulated with indicated concentrations of serotonin for 6 h. Thereafter, activity of SRE was determined. Presented data are the mean ± SEM(n = 4). B, The 5-HT7 receptor activates SRE in a ligand-independent manner. Indicated amounts of the 5-HT7 receptor cDNA were transfected into NIH3T3 cells together with 50 ng of pSRE.L and 50 ng of pCMV-β-gal, and SRE activity was determined. Data points represent the means ± SEM from at least three independent experiments. C, An inverse agonist inhibits 5-HT7 receptor-induced SRE activation. NIH3T3 cells seeded onto 24-well plates were transfected as described in A. Twenty-four hours after transfection, cells were serum-starved for 16 h and treated with 100 nm methysergide. Data points represent the means ± SEM (n = 4). A statistically significant difference between values is indicated (*p < 0.01).
Figure 3.
Figure 3.
5-HT7 receptor-induced SRE activation does not depend on PKA activation. A, NIH3T3 cells were transfected with 100 ng of 5-HT7 receptor cDNA, 50 ng of pSRE.L, and 50 ng of pCMV-β-gal. After serum starvation, cells were treated with 10 μm PKI for 6 h, and SRE activity wasdetermined.B, 5-HT7 receptor-induced CREB activation depends on PKA activation. NIH3T3 cells were transfected with 100 ng of 5-HT7 receptor cDNA or empty pcDNA3 vector together with 75 ng of pFR-luciferase (reporter plasmid) and 4 ng of pFA2-CREB (fusion trans-activator plasmid) for assessment of CREB activation. After serum starvation, cells were treated with 10 μm PKI for 6 h and then CREB activity was determined. Data points represent the means ± SEM from at least three independent experiments. A statistically significant difference between values is indicated (*p < 0.01).
Figure 4.
Figure 4.
The 5-HT7 receptor is functionally coupled to Gα12 to induce SRE activation. A, 5-HT7 receptor-dependent SRE activation is PTX independent. NIH3T3 cells were transfected with 100 ng of 5-HT7 receptor cDNA, 50 ng of pSRE.L, and 50 ng of pCMV-βgal, serum-starved, and treated with 400 ng/ml PTX for 4 h. In several experiments, cells were stimulated with 1 U/ml thrombin for 6 h, and SRE activity was determined as described. Data points represent the means ± SEM from at least four independent experiments performed in duplicate. A statistically significant difference between values is indicated (*p < 0.01). B, Gα12 specifically potentiates 5-HT7 receptor-induced SRE activation. NIH3T3 cells were transfected as described in A together with 200 ng of indicated Gα subunit cDNA. Data points represent the means ± SEM from three independent experiments performed in triplicate. C, SRE activation induced by thrombin is potentiated by Gαq, Gα12, and Gα13 subunits. NIH3T3 cells were transfected as described above, serum-starved, and then stimulated with 1 U/ml thrombin for 6 h followed by determination of SRE activity. Data points represent the means ± SEM from at least three independent experiments performed in triplicate. Luc, Luciferase.
Figure 5.
Figure 5.
The 5-HT7 receptor stimulates RhoA and Cdc42 but not Rac1 GTPases. A, NIH3T3 cells were transfected with 100 ng of 5-HT7 receptor cDNA, 50 ng of pSRE.L, 50 ng of pCMV-β-gal, and 200 ng of C3 toxin cDNA. SRE activity was determined as described above. Presented data are the mean ± SEM (n = 4). A statistically significant difference between values is indicated (*p < 0.01). B, The 5-HT7 receptor activates SRE via RhoA and Cdc42. NIH3T3 cells were transfected with 50ng of pSRE. L, 50ng of pCMV-β-gal, and 100ng of 5-HT7 receptor cDNA together with 200 ng of each dominant-negative RhoA(N19), Rac1(N17), or Cdc42(N17) mutants as indicated. Activity of SRE was determined as described above. Presented data are the mean ± SEM (n = 3). A statistically significant difference between values is indicated (*p < 0.01). C-E, Rho GTPase activation assay. NIH3T3 cells growing on 100 mm dishes were transfected with 5 μg of RhoV14, RacV12, and Cdc42V12 together with the 5-HT7 receptor cDNA, serum starved, and then stimulated with 1 μm serotonin for 5 min. Rho GTPase activation assay was performed as described in Materials and Methods. C, RhoA activity was determined by the amount of RBD-bound RhoA (middle) normalized to the amount of RhoA in whole-cell lysates (bottom). D, Cdc42 activity was determined by the amount of PBD-bound Cdc42 (middle), normalized to the amount of Cdc42 in whole-cell lysates (bottom). E, Rac1 activity was determined by the normalization of amount of PBD-bound Rac1 (middle) to the amount of Rac1 in whole-cell lysates (middle). In parallel, expression of the 5-HT7 receptor was checked by the Western blots (top). Western blots from representative experiments are shown. F, The intensity of bands shown in C-E was quantified by densitometry, and the amount of active GTPase was normalized to the amount of the same GTPase in total cell lysates. Activities are shown as a fold increase compared with baseline and presented as means ± SEM from at least four independent experiments performed in duplicate. A statistically significant difference between values is indicated (*p < 0.01; **p < 0.001). Luc, Luciferase.
Figure 6.
Figure 6.
Regulation of cell morphology by the 5-HT7 receptor in NIH3T3 cells. NIH3T3 cells were transiently transfected with either a control (pTracer) vector or with pTracer vector encoding for the 5-HT7 receptor. Cells were cultured in serum-free medium overnight, and morphology was assessed after stimulation with agonists as indicated. A, Effect of the 5-HT7 receptor expression (with or without agonist stimulation) on the morphology of NIH3T3 cells. Dominant-negative mutants RhoA(N19) and Cdc42(N17) were coexpressed with the 5-HT7 receptor, as indicated. In several experiments, cells were treated with 10 μm cell-permeable PKA inhibitor 14-22 amide (PKI). Data points represent the means ± SEM from at least four independent experiments performed in duplicate. A statistically significant difference between values is indicated (*p < 0.05; **p < 0.01). B, Changes in the shape of cells expressing 5-HT7 receptors. NIH3T3 cells were transfected with pTracer vector encoding for the 5-HT7 receptor. Images shown were recorded by the confocal fluorescence microscopy at the beginning (0 min), during (30 min), and at the end (60 min) of a 1 h exposure to the 1 μm 5-HT with LSM510-Meta microscope at 63× magnification. A nontransfected cell is indicated by a triangle. Scale bar, 10 μm. The video is available as supplemental material (available at www.jneurosci.org). C, Analysis of the actin cytoskeleton in 5-HT7 receptor-expressing cells. NIH3T3 cells were transfected with GFP-tagged 5-HT7 receptor, serum starved, and then subjected to FITC-phalloidin staining. Representative confocal images obtained with LSM510-Meta microscope at 63× magnification are shown. Scale bar, 10 μm.
Figure 7.
Figure 7.
Effect of the 5-HT7R/G12 and 5-HT4R/G13 signaling pathways on neuronal morphology. A, For morphometric analysis of neurite outgrowth, cultured hippocampal neurons were fixed, stained with toluidine blue, and used for operator-controlled tracing of neurites. BIMU8 used at 100 nm is a selective 5-HT4 receptor agonist. GR113808 (GR) used at 2 μm is a highly selective 5-HT4 receptor antagonist. 5-CT used at 100 nm is a selective 5-HT7 receptor agonist. Treatment of the cells with the 5-HT7 receptor antagonist SB269970 (SB) at 100 nm blocked the effect of 5-CT. Data sets were collected after 20 h of treatment with an agonist/antagonist. The bars represent means ± SEM from three independent experiments performed in triplicate. Values obtained for untreated neurons were set to 100%. A statistically significant difference between values is indicated (*p < 0.05). B, Distribution of 5-HT7 and 5-HT4 receptors and Gα12 and Gα13 proteins in hippocampal neurons. The neurons were transfected with either GFP-tagged 5-HT4 or 5-HT7 receptors. The endogenous Gα12 or Gα13 proteins were visualized by immunostaining with specific antibodies. The asterisk indicates a transfected glial cell. Scale bar, 10 μm.

References

    1. Aktories K, Schmidt G, Just I (2000) Rho GTPases as targets of bacterial protein toxins. Biol Chem 381: 421-426. - PubMed
    1. Alves SE, Hoskin E, Lee SJ, Brake WG, Ferguson D, Luine V, Allen PB, Green-gard P, McEwen BS (2002) Serotonin mediates CA1 spine density but is not crucial for ovarian steroid regulation of synaptic plasticity in the adult rat dorsal hippocampus. Synapse 45: 143-151. - PubMed
    1. Amano M, Ito M, Kimura K, Fukata Y, Chihara K, Nakano T, Matsuura Y, Kaibuchi K (1996) Phosphorylation and activation of myosin by Rho-associated kinase (Rho-kinase). J Biol Chem 271: 20246-20249. - PubMed
    1. Azmitia EC (2001) Modern views on an ancient chemical: serotonin effects on cell proliferation, maturation, and apoptosis. Brain Res Bull 56: 413-424. - PubMed
    1. Barnes NM, Sharp T (1999) A review of central 5-HT receptors and their function. Neuropharmacology 38: 1083-1152. - PubMed

Publication types

MeSH terms

LinkOut - more resources