. 2005 Aug;1(2):e25.
doi: 10.1371/journal.pgen.0010025. Epub 2005 Aug 19.

Local regulatory variation in Saccharomyces cerevisiae

Affiliations

Local regulatory variation in Saccharomyces cerevisiae

James Ronald et al. PLoS Genet. 2005 Aug.

Abstract

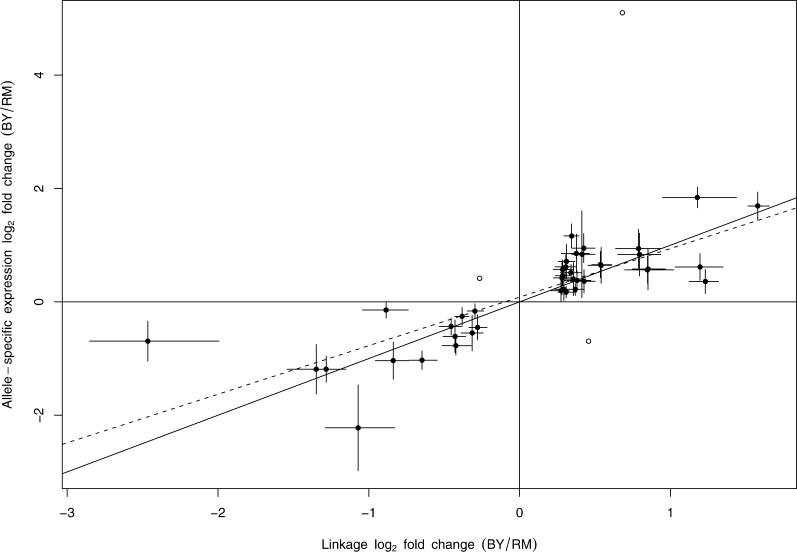
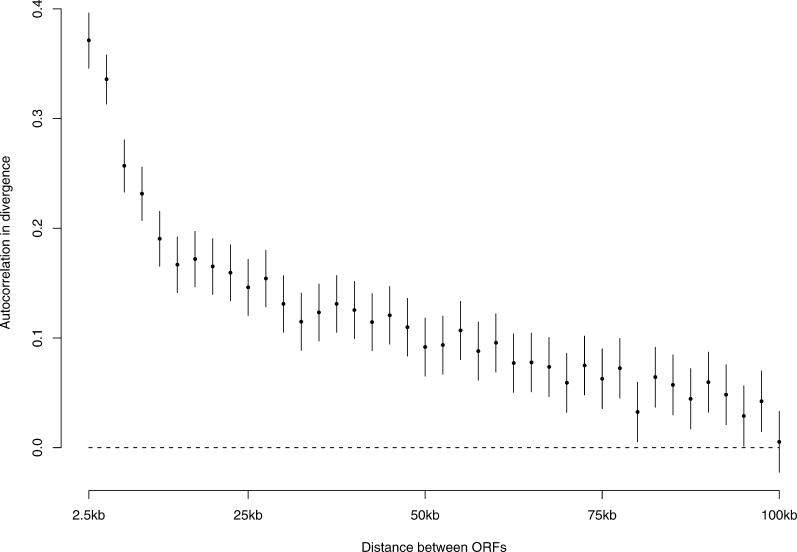
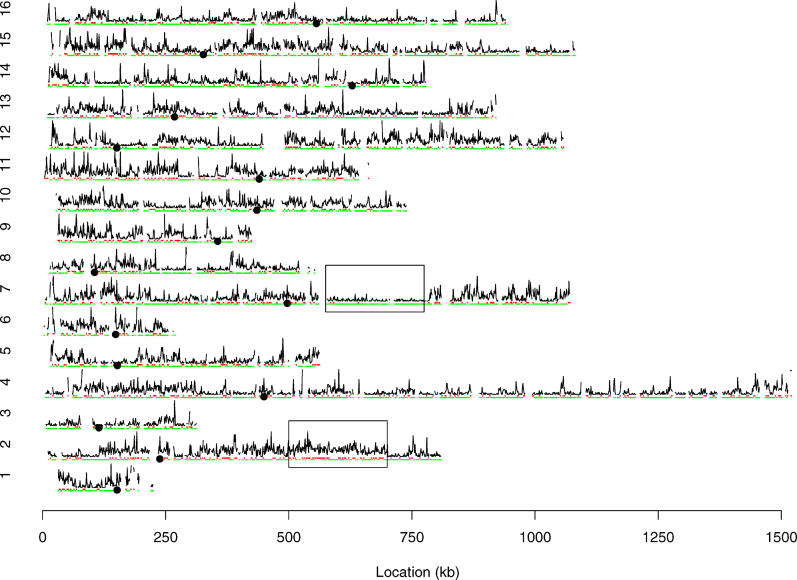
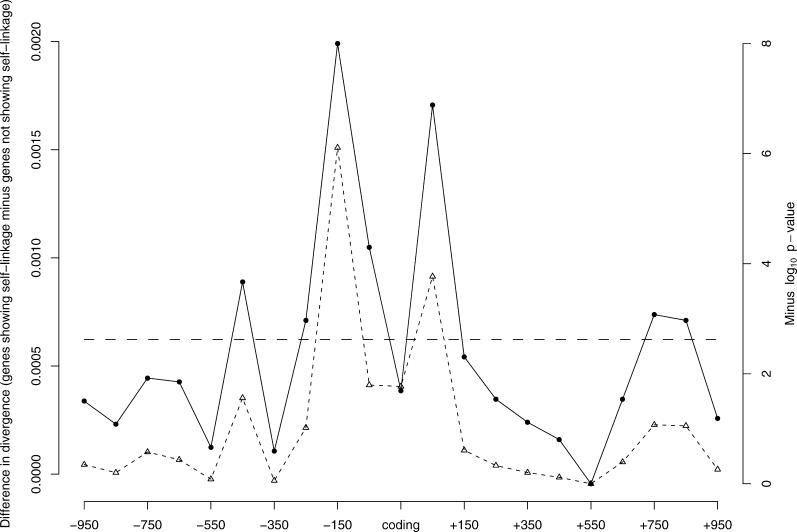
Naturally occurring sequence variation that affects gene expression is an important source of phenotypic differences among individuals within a species. We and others have previously shown that such regulatory variation can occur both at the same locus as the gene whose expression it affects (local regulatory variation) and elsewhere in the genome at trans-acting factors. Here we present a detailed analysis of genome-wide local regulatory variation in Saccharomyces cerevisiae. We used genetic linkage analysis to show that nearly a quarter of all yeast genes contain local regulatory variation between two divergent strains. We measured allele-specific expression in a diploid hybrid of the two strains for 77 genes showing strong self-linkage and found that in 52%-78% of these genes, local regulatory variation acts directly in cis. We also experimentally confirmed one example in which local regulatory variation in the gene AMN1 acts in trans through a feedback loop. Genome-wide sequence analysis revealed that genes subject to local regulatory variation show increased polymorphism in the promoter regions, and that some but not all of this increase is due to polymorphisms in predicted transcription factor binding sites. Increased polymorphism was also found in the 3' untranslated regions of these genes. These findings point to the importance of cis-acting variation, but also suggest that there is a diverse set of mechanisms through which local variation can affect gene expression levels.


Conflict of interest statement

Competing interests. The authors have declared that no competing interests exist.

Figures

Figure 1
Figure 1. Comparison of Linkage and ASE Fold-Change Estimates
Points represent the fold-change estimates from linkage analysis (horizontal axis) and from ASE experiments (vertical axis) for the 44 genes with nominally significant ASE (p < 0.05). Horizontal and vertical bars represent 95% confidence intervals. The solid line (y = x) represents equal fold-change estimates in the two experiments. The dashed line (y = 0.85x + 0.09, R 2 = 0.68) is the best fit, excluding one outlier and the two genes showing ASE favoring the opposite allele than that expected from linkage analysis (open circles).
Figure 2
Figure 2. Autocorrelation in Divergence as a Function of Distance between Genes
Each point indicates the correlation in the rate of substitution polymorphisms in the coding sequences of genes separated by at least x − 2.5 kb and at most x kb, for x = 2.5 kb, 5 kb, 7.5 kb, …, 100 kb. Correlations were similar for rates of substitution polymorphisms in intergenic regions (data not shown). ORFs, open reading frames.
Figure 3
Figure 3. Rates of Substitution Polymorphisms between BY and RM
Chromosome numbers are indicated on the left; large black circles represent centromere locations. Small points indicate gene locations: red, genes showing self-linkage; green, genes not showing self-linkage. The black jagged line represents the rate of substitution polymorphisms per 1,000 bp, with a maximum of 25 polymorphisms per 1,000 bases. The highly diverged Chromosome 2 region and relatively non-diverged Chromosome 7 region described in the text are indicated by boxes.
Figure 4
Figure 4. Increased Divergence in the Promoter Region and 3′ Untranslated Region in Genes Showing Self-Linkage
The numbers of substitution SNPs are counted over each 100-bp bin centered at the position from translation start (or from translation stop for downstream bins) indicated on the x-axis, with the exception of the coding sequence, which is treated as a single bin. Solid line: the difference in inter-strain divergence between 1,125 position-matched pairs of genes, calculated by subtracting the average divergence in genes without self-linkage from the average divergence in genes with self-linkage (the left y-axis indicates difference in divergence in substitutions per basepair). Dotted line: −log10 p-values from logistic regression of self-linkage status on SNP rate in each bin independently, for the 1,125 pairs of genes (the right y-axis indicates −log10[p]); the dashed line shows p = 0.0024 (p = 0.05 after a Bonferroni correction for the 21 bins tested).

References

    1. Brem RB, Yvert G, Clinton R, Kruglyak L. Genetic dissection of transcriptional regulation in budding yeast. Science. 2002;296:752–755. - PubMed
    1. Schadt EE, Monks SA, Drake TA, Lusis AJ, Che N, et al. Genetics of gene expression surveyed in maize, mouse and man. Nature. 2003;422:297–302. - PubMed
    1. Morley M, Molony CM, Weber TM, Devlin JL, Ewens KG, et al. Genetic analysis of genome-wide variation in human gene expression. Nature. 2004;430:743–747. - PMC - PubMed
    1. Monks SA, Leonardson A, Zhu H, Cundiff P, Pietrusiak P, et al. Genetic inheritance of gene expression in human cell lines. Am J Hum Genet. 2004;75:1094–1105. - PMC - PubMed
    1. Bystrykh L, Weersing E, Dontje B, Sutton S, Pletcher MT, et al. Uncovering regulatory pathways that affect hematopoietic stem cell function using ‘genetical genomics'. Nat Genet. 2005;37:225–232. - PubMed

Publication types

MeSH terms

Substances