. 2005 Aug 29:6:214.
doi: 10.1186/1471-2105-6-214.

Sources of variation in Affymetrix microarray experiments

Affiliations

Sources of variation in Affymetrix microarray experiments

Stanislav O Zakharkin et al. BMC Bioinformatics. .

Abstract

Background: A typical microarray experiment has many sources of variation which can be attributed to biological and technical causes. Identifying sources of variation and assessing their magnitude, among other factors, are important for optimal experimental design. The objectives of this study were: (1) to estimate relative magnitudes of different sources of variation and (2) to evaluate agreement between biological and technical replicates.

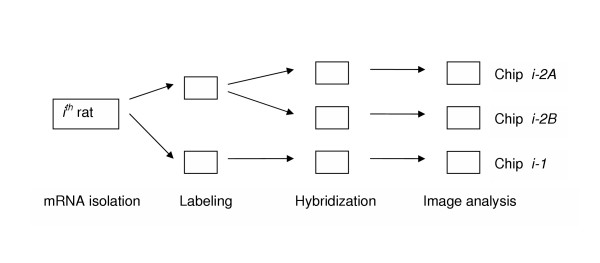
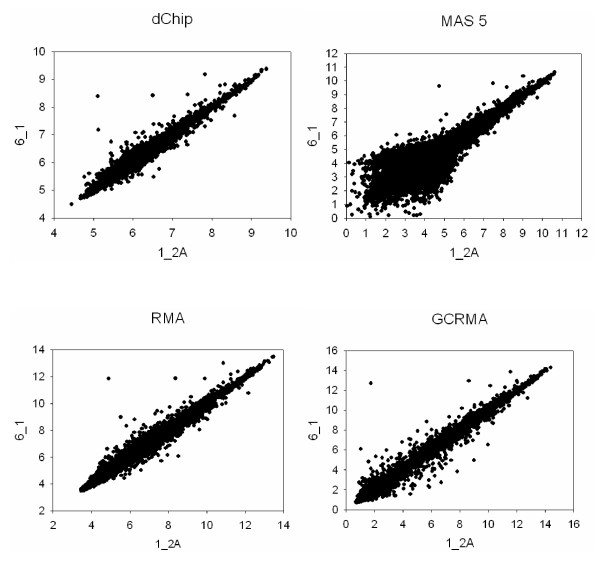
Results: We performed a microarray experiment using a total of 24 Affymetrix GeneChip arrays. The study included 4th mammary gland samples from eight 21-day-old Sprague Dawley CD female rats exposed to genistein (soy isoflavone). RNA samples from each rat were split to assess variation arising at labeling and hybridization steps. A general linear model was used to estimate variance components. Pearson correlations were computed to evaluate agreement between technical and biological replicates.

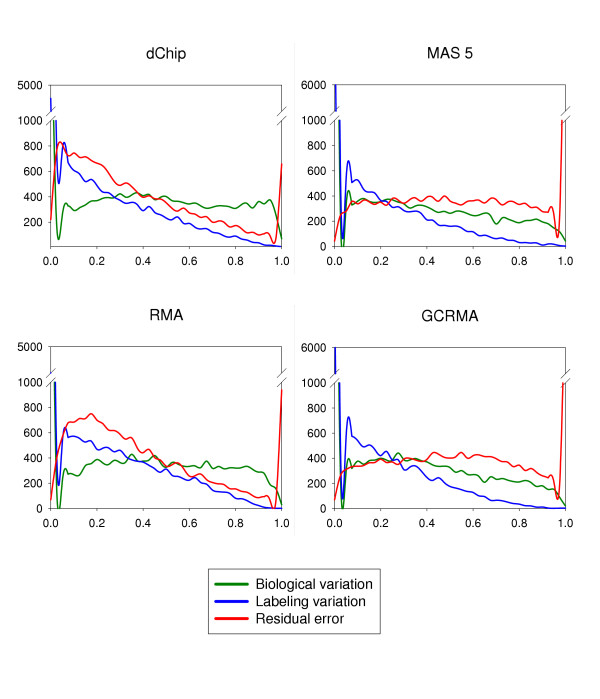
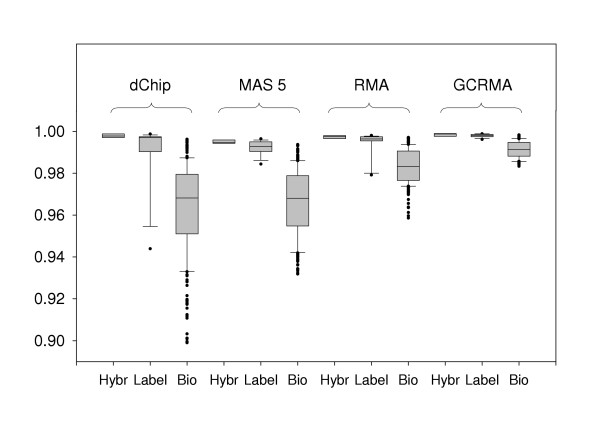
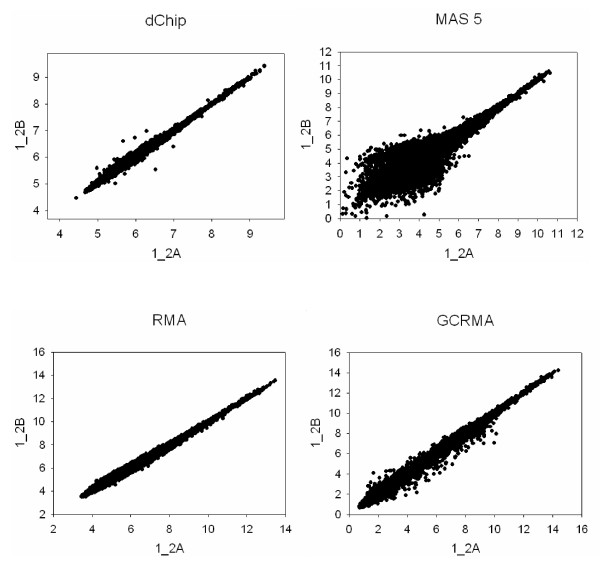
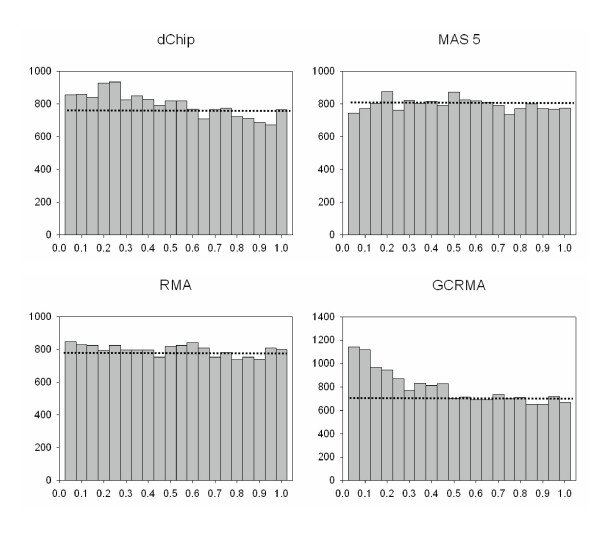
Conclusion: The greatest source of variation was biological variation, followed by residual error, and finally variation due to labeling when *.cel files were processed with dChip and RMA image processing algorithms. When MAS 5.0 or GCRMA-EB were used, the greatest source of variation was residual error, followed by biology and labeling. Correlations between technical replicates were consistently higher than between biological replicates.


Figures

Figure 1
Figure 1
Experimental design. The scheme of hierarchical unbalanced design used in our experiment is shown. A total of 8 rats and 24 chips were used.
Figure 2
Figure 2
Density plots of different sources of variation. Density plots of relative magnitudes of different sources of variation are shown for data analyzed with four image processing algorithms. The proportions of different variance components are shown on x-axis and frequencies of probe sets are shown on y-axis.
Figure 3
Figure 3
Boxplots of pairwise correlations between chips. Box plots of Pearson correlations between technical replicates at the hybridization step (Hybr; i_2A vs. i_2B chips, where i is biological replicate), labeling step (Label; i_1 vs. i_2A and i_1 vs i_2B chips), and between different biological replicates (Bio; all pairwise combinations) are shown for four image processing algorithms (dChip, MAS 5.0, RMA, GCRMA-EB). Technical replicates have consistently higher correlations than different biological replicates.
Figure 4
Figure 4
Comparison of two technical replicates of the same biological replicate using different image processing techniques. Expression levels detected on the 1_2A chip (x-axis) are plotted against levels detected on the 1_2B chip (y-axis). Results obtained with different image processing algorithms are shown. dChip and MAS 5.0 are shown on the log scale for compatibility with RMA and GCRMA-EB. Good agreement between two chips will result in data grouped along the identity line, while lack of agreement will lead to dispersion.
Figure 5
Figure 5
Comparison of two different biological replicates using different image processing techniques. Expression levels detected on the 1_2A chip (x-axis) are plotted against levels detected on the 6_1 chip (B) (y-axis). Results obtained with different image processing algorithms are shown. dChip and MAS 5.0 are shown on the log scale for compatibility with RMA and GCRMA-EB. Good agreement between two chips will result in data grouped along the identity line, while lack of agreement will lead to dispersion.
Figure 6
Figure 6
Distributions of p-values for the paired t-test for hybridization effect. Histograms of p-values for four image processing algorithms. If the global null hypothesis is true, the distribution of p-values would be uniform from 0 to 1 (dotted line). If differentially expressed genes are present, the number of small p-values will be increased.

References

    1. Jain KK. Applications of biochips: from diagnostics to personalized medicine. Curr Opin Drug Discov Devel. 2004;7:285–289. - PubMed
    1. Gracey AY, Cossins AR. Application of microarray technology in environmental and comparative physiology. Annu Rev Physiol. 2003;65:231–259. doi: 10.1146/annurev.physiol.65.092101.142716. - DOI - PubMed
    1. Kerr MK, Martin M, Churchill GA. Analysis of variance for gene expression microarray data. J Comput Biol. 2000;7:819–837. doi: 10.1089/10665270050514954. - DOI - PubMed
    1. Churchill GA. Fundamentals of experimental design for cDNA microarrays. Nat Genet. 2002;32 Suppl:490–495. doi: 10.1038/ng1031. - DOI - PubMed
    1. Yang YH, Speed T. Design issues for cDNA microarray experiments. Nat Rev Genet. 2002;3:579–88. - PubMed

Publication types

LinkOut - more resources