. 2006 Jan;13(1):211-20.
doi: 10.1016/j.ymthe.2005.07.684. Epub 2005 Aug 26.

Dermal wound healing is subject to redox control

Affiliations

Dermal wound healing is subject to redox control

Sashwati Roy et al. Mol Ther. 2006 Jan.

Abstract

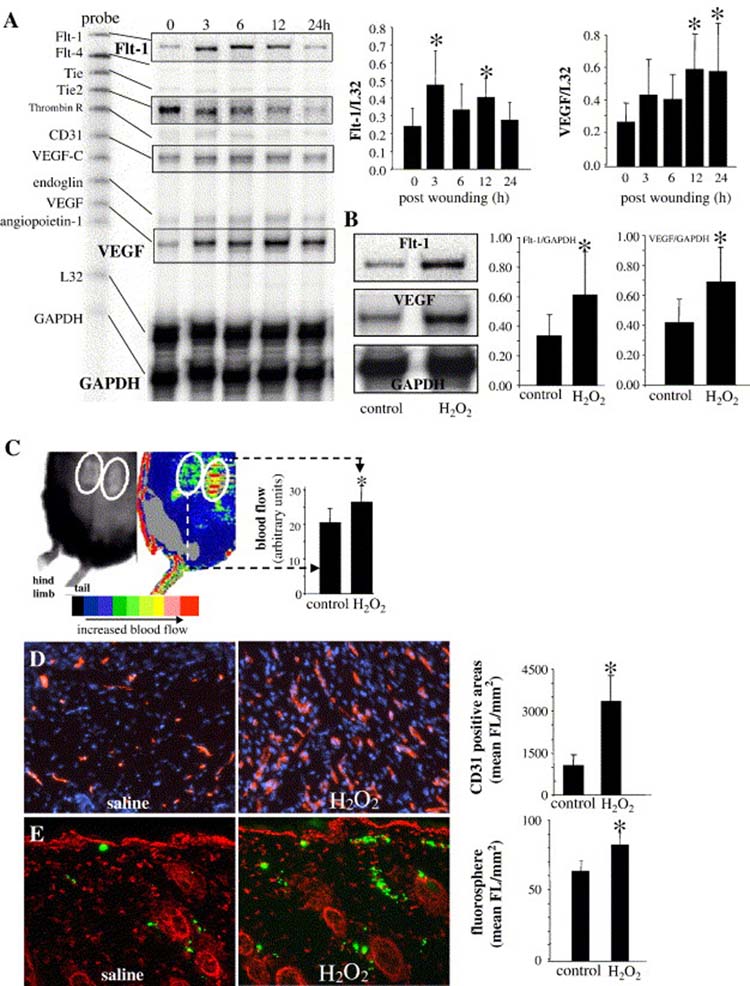
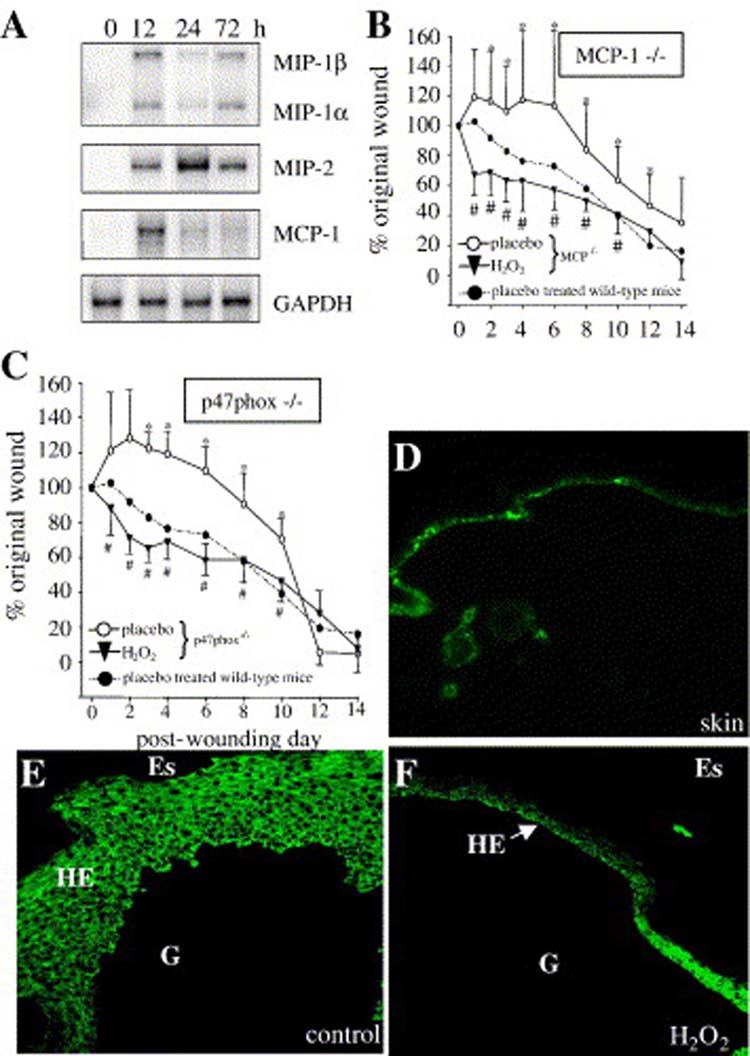
Previously we have reported in vitro evidence suggesting that that H2O2 may support wound healing by inducing VEGF expression in human keratinocytes (C. K. Sen et al., 2002, J. Biol. Chem.277, 33284-33290). Here, we test the significance of H2O2 in regulating wound healing in vivo. Using the Hunt-Schilling cylinder approach we present the first evidence that the wound site contains micromolar concentrations of H2O2. At the wound site, low concentrations of H2O2 supported the healing process, especially in p47(phox)- and MCP-1-deficient mice in which endogenous H2O2 generation is impaired. Higher doses of H2O2 adversely influenced healing. At low concentrations, H2O2 facilitated wound angiogenesis in vivo. H2O2 induced FAK phosphorylation both in wound-edge tissue in vivo and in human dermal microvascular endothelial cells. H2O2 induced site-specific (Tyr-925 and Tyr-861) phosphorylation of FAK. Other sites, including the Tyr-397 autophosphorylation site, were insensitive to H2O2. Adenoviral gene delivery of catalase impaired wound angiogenesis and closure. Catalase overexpression slowed tissue remodeling as evidenced by a more incomplete narrowing of the hyperproliferative epithelium region and incomplete eschar formation. Taken together, this work presents the first in vivo evidence indicating that strategies to influence the redox environment of the wound site may have a bearing on healing outcomes.


Figures

Figure 1
Figure 1. Presence of reactive oxygen species at the wound-site
A. H2O2 concentration in wound fluid. Hunt-Schilling cylinders each were implanted in each of ten 8–10 weeks old C57BL/6 mice. On days 02 and 05, fluid was collected. Plasma, even in the presence of 200 mM NaN3 (added to inhibit peroxidase activity) H2O2 was below detection limits (ND, not detectable); Day 02 and Day 05, to discern the H2O2 –sensitive component of the signal detected in wound fluid 0.03 ml of the azide-free fluid was treated with 350 units of catalase. The catalase sensitive component was interpreted as H2O2. Standard curve was generated using authentic H2O2 tested for UV absorbance. n=4; *, p <0.01 compared to plasma value; †, p<0.01 compared to day 02. B. Superoxide production in normal skin and wound edge tissue. The skin or wound edge samples (n=3) were harvested at 12 h after wounding and immediately frozen in OCT. Fresh 30 micron sections were incubated with DHE (0.01mM, 20min) to detect O2.−. To demonstrate the specificity of DHE signal, superoxide dismutase (SOD, 10 U/ml) was added while incubating the wound edge samples with DHE. i) DHE (red) signal in excised skin tissue, ii) DHE signal in dermal wound edge 12h after wounding, iii) phase contrast image of ii, iv) DHE signal in wound edge in presence of 10U/ml superoxide dismutase, v) phase contrast image of iv. Scale bar = 100 μm.
Figure 2
Figure 2. Topical H2O2 and wound closure
Two 8 x 16 mm full-thickness excisional wounds (inset, day 0, A) were placed on the dorsal skin of mice. Each of the two wounds was topically treated either with H2O2 or saline A. Low-dose of H2O2 (1.25 micromoles/wound; or 0.025 ml of 0.15% or 50 mM solution/wound; once daily, days 0–4, open circles, ○) treatment facilitated closure moderately compared to placebo saline treated (closed circles, •) side. n=6; *, p< 0.05. B. Low dose H2O2 treatment does not influence wound microflora. For determination of surface microflora, wounds (treated with either 1.25 micromole H2O2/wound, open bar, or saline, closed bar) were swabbed (24–48 h post wounding. For deep tissue wound microflora, 48h after wounding eschar tissue was removed, wound bed tissue underneath eschar was sampled and quantitative assessment of bacterial load was performed. Values shown represent mean±SD of CFU of three observations. C. High dose (high, 25 micromoles/wound; closed circles, •, 0.025 ml of 3% solution versus low, 1.25 micromoles/wound or 0.025 ml of 0.15%; open circles, ○, once daily days 0–4, of H2O2 adversely affected closure. *, p< 0.05; compared to low dose H2O2 treatment. D. Comparison of the outcomes of high dose H2O2 treatment (C) with placebo treated wounds (A) in different mice. Compared to placebo saline (open circles, ○, once daily days 0–4) treatment, high dose H2O2 (closed circles, •, 0.025 ml of 3% H2O2) adversely affected closure. n=6; *, p< 0.05.
Figure 3
Figure 3. Wound and H2O2-induced changes in angiogenesis related genes, vascularization and wound-edge blood flow
Paired excisional wounds (Figure 2) were either treated with placebo saline or H2O2 (1.25 micromole/wound, days 0–4, once daily). A. Ribonuclease protection assay showing kinetics of angiogenesis-related mRNA expression in a placebo saline-treated wound. Densitometry data (mean ± SD, n=4) are shown for Flt-1 and VEGF. *, p<0.05 compared to 0h. B. Low dose H2O2 treatment (1.25 micromole/wound, once at day 0) to wounds further augmented wound-induced Flt-1 and VEGF mRNA expressions as determined from wound-edge tissue harvested 6h after wounding and H2O2 treatment. Densitometry data (mean ± SD, n=4) are shown. *, p<0.05 compared to control. C. Blood flow imaging of wounds was performed non-invasively using laser Doppler. Images reflecting the blood flow (right panel) and a digital photo (region of interest; left panel) from post-heal (one day after complete wound closure) tissue are shown. Mean ± SD (n=3) is presented (bar graph; *, p<0.05). D. Day 8 post-wounding, wound-edge was cryosectioned and vascularization was estimated by staining for CD31 (red, rhodamine) and DAPI (blue, nuclei); higher abundance of CD31 red stain in section obtained from H2O2 treated side (right) demonstrate better vascularization versus control (left). Bar graph presents image analysis outcomes (mean ± SD, n=3). *, p<0.05 compared to control. E. Before sacrifice of mice on day 8 post-wounding, space-filling carboxylate-modified fluorescent microspheres were injected into the left ventricle of the beating heart to visualize neovascularization in the healing wound. Cryosections (10 μm) fixed in acetone and stained with DAPI (nuclei, shown here in contrast red) were analyzed by fluorescence microscopy. The appearance of the green microspheres at the wound edge represents wound vascularity. Bar graph presents image analysis outcomes (mean ± SD, n=3). *, p<0.05 compared to control.
Figure 4
Figure 4. H2O2-induced phosphorylation of focal adhesion kinase (FAK) in microvascular endothelial cells and wound edge tissue
HMEC-1 were treated with H2O2 for the indicated dose and duration (n=3). Phosphorylation of FAK was detected using Western blot and phosphorylation site-specific antibodies against FAK. Native FAK was blotted to show equal loading. A. Effect of doses of H2O2 treatment on phosphorylation (Tyr 925) state of FAK. B. Kinetics of site-specific phosphorylation of FAK in HMEC cells following H2O2 (0.1 mM) treatment. C. Paired excisional wounds (Fig 2) were either treated with placebo saline or H2O2 (1.25 micromole/wound). Wound-edge tissue (n=3) was collected 30 min after wounding.
Figure 5
Figure 5. Role of H2O2 in MCP-1 and p47phox deficient mice
Two excisional wounds (Fig 2) were placed on the dorsal skin of wild-type, MCP-1−/− or p47phox −/− mice. Each of the two wounds was treated with either saline or H2O2 (1.25 micromoles/wound; days 0–4). A. RPA showing kinetics of monocyte/macrophage chemotactic protein related mRNA expression in placebo saline-treated wounds of wild-type mice (n=3). B. Wound closures in saline (closed circles, •) treated wounds of C57BL/6 and H2O2 (closed triangles, ▾) or saline (open circles, ○) treated MCP-1−/− mice are shown. n=7; * p< 0.05; compared to C57BL/6 saline treatment. #, p< 0.05; compared to KO saline treatment. C. Wound closures in saline (closed circles, •) treated wounds of C57BL/6 and H2O2 (closed triangles, ▾) or saline (open circles, ○) or p47phox KO mice are shown. *p< 0.05; compared to C57BL/6 saline treatment. #, p< 0.05; compared to KO saline treatment. D. Keratin 14 (green fluorescence) expression in murine skin. E–F. Keratin 14 expression in skin of of p47phox KO mice harvested from wound sites after closure on day 18 post-wounding. Note higher expression of keratin 14 in control side (E) compared to H2O2-treated side (F) indicating healing is ongoing on the control side, while H2O2 treated side shows keratin 14 expression comparable to normal skin (D). For orientation (see histological identifying characteristics in Fig. 6C): Es, eschar; G, granulation tissue; HE, hyperproliferative epithelium.
Figure 6
Figure 6. Catalase over-expression impairs healing
A. Western blot of infected (1011 CFU) skin showing catalase over-expression in the side treated with AdCatalase (AdCat) virus compared to the side treated with control AdLacZ virus. Blots were re-probed with β–actin to confirm equal loading of samples. Activity assay demonstrated that the AdCat approach was effective in significantly (*, p<0.05) increasing catalase activity in the tissue compared to the AdLacZ control. B, VEGF protein expression in wound-edge on day 1 post-wounding. C, Blood flow at the wound-site on day 6 post-wounding. Blood flow imaging of wounds was performed non-invasively using a laser Doppler blood flow imaging device as described in the legend of Fig. 3C. D. Dotted line represents standard healing curve of saline treated C57BL/6 mice (open circles, ○) without viral infection. AdCat treatment (closed triangles, ▾); AdlacZ treatment (closed circles, •); *p < 0.05, compared to LacZ treated side. E. Masson trichrome staining was performed on formalin fixed paraffin sections of regenerated skin at the wound-site sampled on the day both wounds closed. AdCat side (right) shows broader HE region indicative of incomplete (vs. control on left) regeneration of skin, consistent with slower closure. The wound-edge is marked with an arrow. Es, eschar; G, granulation tissue; HE, hyperproliferative epithelium.

References

    1. Gordillo GM, Sen CK. Revisiting the essential role of oxygen in wound healing. Am J Surg. 2003;186:259–263. - PubMed
    1. Kivisaari J, Vihersaari T, Renvall S, Niinikoski J. Energy metabolism of experimental wounds at various oxygen environments. Annals of Surgery. 1975;181:823–828. - PMC - PubMed
    1. Grief R, Akca O, Horn EP, Kurz A, Sessler DI. Supplemental perioperative oxygen to reduce the incidence of surgical-wound infection. Outcomes Research Group.[see comment] New England Journal of Medicine. 2000;342:161–167. - PubMed
    1. Sen CK. The general case for redox control of wound repair. Wound Repair Regen. 2003;11:431–438. - PubMed
    1. Suh YA, Arnold RS, Lassegue B, Shi J, Xu X, Sorescu D, Chung AB, Griendling KK, Lambeth JD. Cell transformation by the superoxide-generating oxidase Mox1. Nature. 1999;401:79–82. - PubMed

Publication types

MeSH terms

LinkOut - more resources